Download
1 / 1
20 likes | 161 Views
You and your lab partner independently determine the concentration of Ca 2+ in a water sample. The results are: You Lab partner 350 ppm 342 ppm 345 ppm 337 ppm 342 ppm 335 ppm 348 ppm 340 ppm

E N D
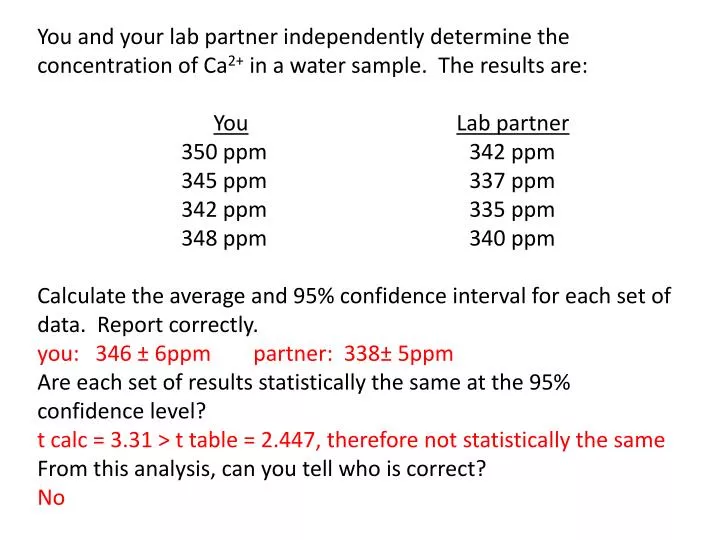
You and your lab partner independently determine the concentration of Ca2+ in a water sample. The results are: YouLab partner 350 ppm 342 ppm 345 ppm 337 ppm 342 ppm 335 ppm 348 ppm 340 ppm Calculate the average and 95% confidence interval for each set of data. Report correctly. you: 346 ± 6ppm partner: 338± 5ppm Are each set of results statistically the same at the 95% confidence level? t calc = 3.31 > t table = 2.447, therefore not statistically the same From this analysis, can you tell who is correct? No