Download
1 / 21
210 likes | 280 Views
Explore the fascinating process of genetic inheritance in garden peas through cross-fertilization and seed development. Learn about alleles, chromosomes, and Punnett squares.

E N D
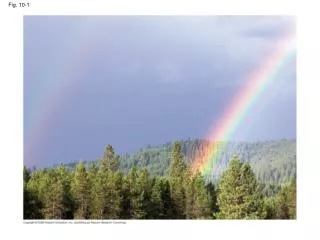
ATP ATP Fig. 10-1b, p.152
carpel stamen a Garden pea flower, cut in half. Sperm form in pollen grains, which originate in male floral parts (stamens). Eggs develop, fertilization takes place, and seeds mature in female floral parts (carpels). b Pollen from a plant that breeds true for purple flowers is brushed onto a floral bud of a plant that breeds true for white flowers. The white flower had its stamens snipped off. This is one way to assure cross-fertilization of plants. c Later, seeds develop inside pods of the cross-fertilized plant. An embryo within each seed develops into a mature pea plant. d Each new plant’s flower color is indirect but observable evidence that hereditary material has been transmitted from the parent plants. Fig. 10-3, p.154
a A pair of homologous chromosomes, both unduplicated. In most species, one is inherited from a female parent and its partner from a male parent. b A gene locus (plural, loci), the location for a specific gene on a chromosome. Alleles are at corresponding loci on a pair of homologous chromosomes c A pair of alleles may be identical or not. Alleles are represented in the text by letters such as D or d. d Three pairs of genes (at three loci on this pair of homologous chromosomes); same thing as three pairs of alleles. Fig. 10-4, p.155
Homozygous dominant parent Homozygous recessive parent (chromosomes duplicated before meiosis) meiosis I meiosis II (gametes) (gametes) fertilization produces heterozygous offspring Fig. 10-5, p.156
Trait Studied Dominant Form Recessive Form F2 Dominant-to-Recessive Ratio Seed shape 5,474 round 1,850 wrinkled 2.98:1 Seed color 6,022 yellow 2,001 green 3.01:1 Pod shape 2.95:1 882 inflated 299 wrinkled Pod color 428 green 152 yellow 2.82:1 Flower color 705 purple 224 white 3.15:1 Flower position 3.14:1 651 long stem 207 at tip Stem length 2.84:1 277 dwarf 787 tall Fig. 10-6, p.156
female gametes a a a a A A A A A A A Aa Aa A AA male gametes a a a aa a Aa aa Aa aa aa Aa a From left to right, step-by-step construction of a Punnett square. Circles signify gametes. A stands for a dominant allele and a for a recessive allele at the same gene locus. Offspring genotypes are indicated inside the squares. Fig. 10-7a, p.157
F1 offspring aa True-breeding homozygous recessive parent plant a a Aa Aa Aa Aa A AA A Aa Aa True-breeding homozygous dominant parent plant Aa Aa b Cross between two plants that breed true for different forms of a trait. Fig. 10-7b, p.157
F2 offspring Aa Heterozygous F1 offspring a A Aa AA A AA Aa Aa a Aa aa Heterozygous F1 offspring Aa aa c Cross between heterozygous F1 offspring. Fig. 10-7c, p.157
A a AA (dominant) AA A Aa the expected phenotypic ratio of 3:1 (dominant) Aa (dominant) Aa a Aa aa aa (recessive) p.165
Meiosis, gamete formation in true-breeding parent plants parent homozygous dominant for purple flowers, tall stems parent homozygous recessive for white flowers, short stems Gametes at fertilization Possible genotypes resulting from a cross between two F1 plants: meiosis, gamete formation meiosis, gamete formation All F1 plants are AaBb heterozygotes with purple flowers and tall stems. Fig. 10-9, p.159
AA BB or or Genotypes: AO AB BO OO Phenotypes (Blood type): A AB B O Fig. 10-10, p.160
homozygous parent (RR) homozygous parent (rr) heterozygous F1 offspring (Rr) x Cross two of the F1 plants, and the F2 offspring will show three phenotypes in a 1:2:1 ratio: RR Rr Rr rr Fig. 10-11, p.160
EB Eb eB eb EEBB black EEBb black EeBB black EeBb black EB EEBb black EEbb chocolate EeBb black Eebb chocolate Eb EeBB black EeBb black eeBB yellow eeBb yellow eB eeBb yellow eebb yellow EeBb black Eebb chocolate eb Fig. 10-13, p.161
This red graph line of the range of variation for a trait in a population plots out as a bell-shaped curve. Such curves indicate continuous variation in a population. Number of individuals with a measurable value for the trait Range of values for the trait Fig. 10-19a, p.164