Download
1 / 42
420 likes | 559 Views
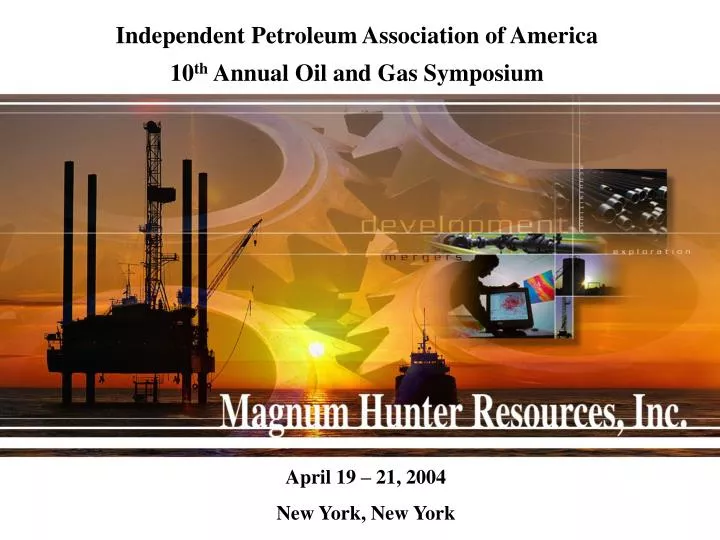
Independent Petroleum Association of America 10 th Annual Oil and Gas Symposium. April 19 – 21, 2004 New York, New York. Company Overview.

E N D
Independent Petroleum Association of America 10th Annual Oil and Gas Symposium April 19 – 21, 2004 New York, New York
Company Overview • Long-lived reserves, high quality, and geographically concentrated in the heart of the oil patch (Texas, Oklahoma, New Mexico, Arkansas and Gulf of Mexico) • Reserve replacement ratio of 436% since 2001 (three years) • Three year average Finding and Development Cost (all sources) $1.22/Mcfe • Production 70% natural gas and 30% crude oil • 5+ year drilling inventory of around 2,640 onshore locations/232 OCS Blocks • High historical drilling success rate – 93% (five year average) • We operate approximately 80% of our properties • Diversified down the food chain as an operator, producer, gatherer, processor and marketer of our own products
Mid-Continent Mid-Continent 246 Bcfe 74% gas 29% of total reserves PV-10 $397 million 246 Bcfe 74% gas 29% of total reserves PV-10 $397 million Gulf Coast Gulf Coast 72 Bcfe 83% gas 9% of total reserves PV-10 $143 million 72 Bcfe 83% gas 9% of total reserves PV-10 $143 million New Core Area Coalbed Methane Play San Juan Basin New Core Area Coalbed Methane Play San Juan Basin Permian Basin Permian Basin 438 Bcfe 43% gas 52% of total reserves PV-10 $633 million 438 Bcfe 43% gas 52% of total reserves PV-10 $633 million 1+ Tcf Potential 1+ Tcf Potential Offshore Continental Shelf Corporate Headquarters District & Field Offices Offshore Offshore 82 Bcfe 76% gas 10% of total reserves PV-10 $308 million 82 Bcfe 76% gas 10% of total reserves PV-10 $308 million Principal Producing Areas
Mineral Leasehold Acreage Ownership Position (Net Acres) As of March 1, 2004 1,625 371 ND 25,555 2,720 WY 1,804,535 IL 8,063 140 IN 310 NV 2,634 382 26,329 416 11,261 1,379,697 209,532 6,873 7,006 UT 480 KS MO CA 61,187 455,406 41,726 1,814,731 105,098 12,519 12,873 130,923 AZ 1,200 OK 1,508,156 27,325 AR 80 NM MS 353,560 283 1,348 86,001 TX Developed 589,999 Acres 1,308 67,579 LA Undeveloped 470,343 Acres Leased Option Acreage 1,964,345 Acres 45,486 Remaining Acreage Options 5,541,409 Acres GOM 350,599 Total 8,566,096 Acres 720 CO
Menefee Coal Evaluation (New Magnum Hunter Lease Option Acreage) Property Description Lease: Grand Total/Southern San Juan Basin • The Upper and Lower Menefee coals contain an estimated combined resource potential of 1.88 Tcf of reserves on Magnum Hunter’s acreage position • Recoverable gas-in-place is estimated at 504 Bcf and 626 Bcf • for the Upper and Lower Menefee coals (at a 60% recovery factor), respectively, for a combined recovery of 1.13 Tcf • Gas content for the coals has been estimated by in-house Magnum Hunter personnel from 20 scf/ton to 70 scf/ton, with the higher of the content being in the Lower Menefee coal Reservoir: Menefee Formation Operator: Magnum Hunter Resources/CDX Counties: McKinley, Sandoval, San Juan, Cibola, Bernalillo, Valencia, Catron, Socorro State: New Mexico Volumetric Calculation Gas Content (scf/ton) 44 Recoverable GIP (Mscf/acre-ft) 63.5 Coal Density (g/cc) 1.750 Eff. Drainage Radius (ft) 48,133 Coal Density (ton/acre-ft) 2379 Net acre-ft 17,800,876 Area (acres) 167,089 Net Pay (ft) 107 GIP (Bscf) 1,883 Recovery Factor (%) 60% Dry Gas Ultimate Recovery (Bscf)1 1,130 (1) The reserves presented herein may differ from the forecast due to economic limits reached. Upper Menefee Coal Structure Map Stratigraphic Column Kirkland SH • The Menefee Formation of the Upper Cretaceous Mesaverde Group contains abundant coal beds that are estimated • to contain 34 Tcf in the San Juan Basin • Until recently, the resource potential in • the Menefee coals was overlooked due to the development and exploitation of the Fruitland coal Fruitland Coal Pictured Cliffs Ss Lewis Sh Cliff House Ss Cretaceous Mesaverde Group Menefee Fm Point Lookout Ss Mancos Sh Dakota Ss Coal Deposit New Core Area San Juan Basin Calculation of Resource Potential
Net Coal Thickness Natural Gas Content 95 100 1000 San Juan (Menefee Coal) 90 Piceance 900 Powder Piceance San Juan River (Fruitland Coal) 80 800 70 700 Canaba 600 60 San Juan Net Coal Thickness (feet) Gas Content (scf/ton) (Fruitland Coal) Uinta 50 500 Black Green C. Raton River Warrior Forest Green Appalachia City 400 Raton 40 River Black Warrior C. 300 Canaba 30 Arkoma N. Uinta N. Appalachia Appalachia Cherokee Appalachia 200 20 Powder Forest River Cherokee City San Juan 100 10 Arkoma (Menefee Coal) 50 0 0 Recovery Factor Coal Density 2.00 1.00 San Juan (Fruitland Coal) 1.90 0.90 Black 1.80 0.80 Powder Warrior Green River Green River Raton San Juan 1.70 0.70 c. River Uinta (Fruitland Coal) 0.60 Appalachia San Juan Cherokee Raton (Menefee Coal) 1.60 Cherokee Black Coal Density (g/cc) Recovery Factor (fraction) Uinta Warrior Powder 1.50 0.50 Piceance River San Juan (Menefee Coal) 1.40 0.40 1.32 0.30 Piceance 1.20 0.20 1.10 0.10 1.00 0.00 U.S. Coalbed Statistics Source: Merrill Lynch
$6.00 Peak lll ($1.21/mcfe) 60/40 Gas/Oil 12 Mth. Strip $5.00 Average Transaction Price Per MCFE $4.00 Peak l ($0.87/mcfe) Peak ll ($1.06/mcfe) $3.00 $2.00 Trough Ill ($0.83/mcfe) Trough ll ($0.75/mcfe) $1.00 12/06/02 07/03/03 08/11/00 12/24/03 05/10/02 09/26/97 06/18/99 03/09/01 01/14/00 10/05/01 02/28/97 11/20/98 01/05/96 08/02/96 04/24/98 Acquisition/Divestiture History Timing is Key to Profitable Growth So. LA 05//03 ($13.4 MM) So. TX 11/02 ($33 MM) Louis Dreyfus 08/00 ($15.8) Misc. Sales 09/02 –12/02 ($17 MM) G.E. Capital 09/02 ($50 MM) GE Capital 06/00 ($23 MM) Mallon 09/01 $31.3 MM Dynegy 11/99 $4.3 MM Vastar 06/99 $32.5 MM Panoma 06/96 $34.7 MM Trough l ($0.88/mcfe) TEL Offshore 03/98 $10.4 MM Prize Energy 03/02 $550 MM Permian Basin 04/97 $133.8 MM Spirit 76 12/98 $25.5MM Sources: Morgan Stanley Equity Research; Herold’s Company
Mid-Continent $11 Million Mid-Continent $10 Million Gulf Coast (Onshore) $6 Million Permian Basin $39 Million Gulf Coast (Onshore) $5 Million Permian Basin $50 Million 6% 3% 23% 7% 3% 33% 68% 57% Gulf of Mexico $119 Million Gulf of Mexico $85 Million 2003 Expenditures2004 Capital Budget 2003 $175 Million 2004 $150 Million
Gulfport Louisiana Baton Rouge Lake Charles New Orleans Lafayette Beaumont MP 178 Main Pass West Cameron East Cameron High Island South Marsh Island Eugene Island South Timbalier Vermillion Ship Shoal Grand Isle ST 265 Ewing Bank Green Canyon Lease Sale Blocks Undeveloped Leases Currently Drilling New Discoveries Currently Producing Gulf of Mexico Gulf of Mexico Magnum Hunter GOM Lease Ownership and Discoveries
Offshore Gulf of Mexico • Large inventory of 174 OCS Blocks (800,000 gross acres) • - 55 New Blocks awarded at 2004 Central GOM Sale (Highest Bidder Overall) • Over 25 Blocks have Deep Shelf identified prospects • Additional 25% net profits interest in 17 additional OCS Blocks with 29% ownership in TEL Offshore Trust • All 3-D seismic controlled with new vintage data • Prospects located near existing production facilities • Reserve potential of 10-500 Bcfe per prospect • 81% drilling success rate with 79 out of 97 GOM wells completed thru December 31, 2003 • GOM rate of return (since inception thru December 31, 2003) ROI ROR Proved 1.48 13.2% Proved & Probable 2.15 22.5% Proved, Probable & Possible 2.39 24.1%
271.5 70.1 Offshore Gulf of Mexico Discoveries on Production since entering GOM in May 1999
Project Area Production Operator WI Estimated First Production Date Potential Daily Net Production (MMCFE) Remington 40% 3rd Qtr. 2004 3.5 East Cameron 205 Remington 50% 2nd Qtr. 2004 5.0 Eugene Island 304 40% 2nd Qtr. 2004 W. Cameron 458 Remington 40% 2nd Qtr. 2004 4.0 W. Cameron 457 Remington 4.0 Total Estimated (MHR Net): 16.5 Offshore Gulf of Mexico Recent Discoveries/Production Pending
Prospect Operator Working Interest Estimated Gross Reserves Depth Spud Date Ship Shoal 358 A-2 ATP 15% 15 BCFE 8,900’ Drilling Main Pass 234 Newfield 25% 23 BCFE 14,500’ Drilling East Cameron 205 Remington 40% 20 BCFE 8,650’ Completed Ship Shoal 165 Remington 25% 40 BCFE 14,000’ Drilling Main Pass 99 Forest 25% 30 BCFE 14,100’ Drilling Vermillion 241 Remington 50% 16 BCFE 10,800’ 2nd Qtr. W. Cameron 295 Magnum Hunter 30% 60 BCFE 17,668’ Drilling S. Tim. 261/262 Magnum Hunter 50% 100 BCFE 15,500’ 2nd Qtr. W. Cameron 398 Remington 40% 15 BCFE 7,730’ 2nd Qtr. S. Marsh Island 24 A-3 Remington 30% 15 BCFE 7,383’ 2nd Qtr. Total Potential Gross Reserves: 354 BCFE S. Marsh Island 113 Remington 50% 10 BCFE 7,000’ 2nd Qtr. 106 BCFE Total Potential MHR Net Reserves: W. Cameron 567 Gryphon 37.5% 30 BCFE 12,500’ Drilling 2004 Offshore Exploration / Development
67,500 65,000 57,500 56,910 56,232 52,599 42,022 40,236 40,958 40,630 34,650 25,056 7,600 3,300 1999 2000 2002 2002 2002 2002 2003 2003 2003 2003 2004E 2004E 2004E 2001 Offshore Gulf of Mexico Production Initiated Drilling in GOM - 1999 Annual Growth Rate = 89% MCFE Per Day
44 wells drilled successfully • 42 wells completed • Average per well IP = 2.0 • MMCFE per day (gross) • 2 new wells in various • completion stages • Recently acquired farm-ins on 20,000 gross mineral acres, with 30 to 50 new drilling locations identified. Currently negotiating new farm-ins on an additional 15,000 gross mineral acres to further increase acreage position Jan. 99 Jan. 96 Jan. 97 Jan. 98 Jan. 00 Jan. 02 Dec. 03 Jan. 01 Jan. 03 NEW MEXICO MORROW – ATOKA - STRAWN PROGRAM Two Drilling Rigs Working Continuously
45,000 31,989 24,486 20,443 15,672 Year-End Estimate S. E. New Mexico Gas Production All Sources Compounded Annual Growth Rate = 30% Net Production – Mcfe/Day
Onshore Inventory Locations (Including Recompletions) * As estimated by third party engineering firm DeGolyer and MacNaughton
2003 Drilling Activity ($174.6 million) Successful P&A’d Total Success Ratio Exploration 8 25 68% 17 1 2 99% 98% Development Development 98 93 99 95 115 9 124 93% Total 2002 Drilling Activity ($127.0 million) Exploration 11 3 14 79% Exploration 6 29 79% 23 Development 15 2 17 88% 116 8 124 94% Total 2001 Drilling Activity ($159.7 million) Exploration 4 13 69% 9 2 98% Development 85 87 6 100 94% 94 Total 2000 Drilling Activity ($60.7 million) Exploration 34 2 36 94% Development 52 0 52 100% Total 86 2 88 98% Total 26 5 31 84% 1999 Drilling Activity ($21.7 million) Drilling Activity – Gross Wells Drilled
Peer Group 2003 Finding and Development Costs per Mcfe (All Sources – three year average) Average: $ 1.35 Median: $ 1.29 Source: Company Data
Net Daily Production Growth 220,000 Compounded Annual Growth Rate = 31% 200,143 194,338 Average Daily Production (MCFE) 91,292 74,777 Mid-Point Est. Note: Excludes net daily production lost from asset sales of 39,926 MMcfe per day over this period.
Gulf Coast (onshore) 17 MMcfe/d Mid-Continent 44 MMcfe/d Permian Basin 86 MMcfe/d 8% 22% 42% 28% Gulf of Mexico 57 MMcfe/d Production By Product Reserves By Category PDP Gas Oil 31% 64% 10% 69% PDNP 26% PUD Production by Area
32.4% MHR Cash Flow Per Share (Debt Adjusted) Five Year Annual Growth Rate Large/Mid/Small Caps1998 - 2002 % Change PERCENTAGE Source: Lehman Brothers
Natural Gas Equivalents (Bcfe) Compounded Annual Growth Rate = 32% Billion Cubic Feet Equivalent Exploration Acquisitions & Mergers Development & Exploitation History of Reserve Growth 837 Bcfe 838 Bcfe 378 Bcfe 367 Bcfe 55% 59% 66% 63% 45% 41% 37% 34% 98% Drilling Success MallonAcquisition Prize Acquisition 93% Drilling Success
Peer Group Three Year Average All Sources Reserve Replacement Ratio (2001 – 2003) Average: 276% Median: 260% 861% 627% 455% 450% 576% 436% 552% 485% 411% 277% 280% 264% 270% 329% 324% 260% 313% 224% 249% 216% 226% 214% 174% 173% 164% 189% 189% 164% 149% 140% 102% 82% 37% Source: Company Data
$395,600* $325,014 $265,869 Average Annual Growth Rate = 40% $152,806 $127,510 $69,626 $51,400 1998 1999 2000 2001 2002 2003 2004E Yearly Growth in Revenues ($000’s) * Average consensus of the ten Equity Analysts that currently follow Magnum Hunter Resources, Inc. The Benchmark Price Consensus from these analysts for 2004 is $5.38 per Mcf and $30.76 per Barrel.
$0.22 $0.21 $0.19 Per Mcfe Produced * Effective Jan. 1, 2003 Magnum Hunter began expensing the fair market value of stock options pursuant to SFAS No.’s 123 and 148. For the year ended Dec. 31, 2003 Magnum Hunter recorded a non-cash compensation expense of $3 million which is reflected in 2003’s G&A total of $15.3 million. The 2003 G & A expense per Mcfe of $0.17, as reflected above, has been adjusted for the 2003 SFAS No.’s 123 and 148 non-cash charge of $3 million in order to be congruent with prior years. Operating EfficiencyImprovements G & A Expenses per Mcfe Produced Total Wells/Operated Wells Compounded Annual Decline in Overhead = 8% Compounded Annual Growth in Well Count = 22% 5,612 5,591 $0.17 3,241 3,042 4,428 4,399 2,230 2,168
Peer Group 2003 G & A Costs per Mcfe Average: $ .25 Median: $ .24 Source: Company Data Note: Excludes non-cash charge for stock options expense
Dec. 31, 2003 Dec. 31, 2002 Dec. 31, 2001 Dec. 31, 2000 Dec. 31, 1999 $ 100,337 Current Assets $ 97,973 $ 25,106 $ 34,838 $ 15,712 1,095,883 Net Property, Plant and Equipment 1,001,609 260,532 265,195 419,837 Other Assets 69,672 9,442 20,242 23,115 70,074 TOTAL ASSETS $ 1,265,892 $ 1,169,656 $ 454,385 $ 315,612 $ 304,022 $ 105,503 Current Liabilities $ 48,713 $ 30,717 $ 17,026 165,000 Bank Debt $ 128,996 155,000 51,120 94,800 425,000 Senior Debt and Convertible Notes 125,000 129,466 140,000 140,000 180,713 Other Liabilities 429,466 3,232 359 644 135,998 TOTAL LIABILITIES 876,216 819,460 336,411 222,196 252,470 STOCKHOLDER’S EQUITY 389,676 350,196 117,974 93,416 51,552 TOTAL LIABILITIES & STOCKHOLDERS’ EQUITY $ 1,265,892 $ 1,169,656 $ 454,385 $ 315,612 $ 304,022 Debt/Book Capitalization Ratio Debt/Market Capitalization Ratio 60%50% 61%57% 71%49% 67%37% 82% 80% Condensed Balance Sheets ($ in Thousands)
Magnum Hunter Resources, Inc. ("MHR") Issuer: Book-running managers: Deutsche Bank Securities, Bank of America Rule 144A for life 100% of par Proceeds: $125 million Reference share price: Status: Senior, Unsecured Put feature: Form of registration: Contingent conversion: Maturity: December 15, 2023 Denomination: $1,000 per bond Issue/redemption price: Use of proceeds: Coupon (q.): 3 month LIBOR (Currently 1.11%) Yield-to-maturity (q.): 3 month LIBOR Initial coupon rate: 1.17000% (Official BBA USD Libor fixing rate at 11:00 AM London time on December 11, 2003) Conversion premium: 45.0% $8.41 (NYSE closing price on December 11, 2003) Conversion price: $12.19 Conversion ratio: 82.0345 shares per $1,000 bond (approximate) Call feature: Unconditionally callable after year 5 Puttable in years 5, 10, 15 Conversion type: Net share settle Yes, trigger at 110% Contingent payment: None Dividend protection: Full dividend protection for the life of the instrument via conversion price adjustment Trade date: December 12, 2003 Settlement date: December 17, 2003 Interest payment dates: March 15, June 15, September 15 and December 15 (quarterly in arrears) First coupon date: March 15, 2004 Cusip: 55972FAE4 ISIN: US55972FAE43 Magnum Hunter has used the net proceeds from the offering to repay outstanding indebtedness under Magnum Hunter's revolving credit facility Magnum Hunter Senior Unsecured Convertible Notes
$0.74 $0.74 $0.67 $0.61 $0.58 $0.55 2002 2003 2003 2003 2003 2004E Interest Expense Per Mcfe Produced
$5.09 59% Realized price per Mcfe (net) $4.08 $3.92 $3.70 $3.92 $3.63 Cash margin as a percent of realized price per Mcfe $3.49 51% $3.36 48% 46% 45% 41% Net cash margin percent 42% 42% 41% $2.99 $3.02 $2.01 $1.87 $1.85 $1.72 $1.45 $1.50 $1.41 $1.22 4th Qtr 2003 1st Qtr 2004E 3rd Qtr 2003 1st Qtr 2003 3rd Qtr 2002 4th Qtr 2002 2nd Qtr 2002 2nd Qtr 2003 1st Qtr 2002 Net Cash Margin Improvement • Old commodity hedges gone as of December 31, 2003 • Sold bulk of higher lifting cost properties • Redeemed $140 million of 10% high yield debt • Placed $125 million convertible debt at 1.11% interest rate (floating) Note: Net cash margin is defined as the realized price per Mcfe less LOE, production taxes, G & A expense (recurring), and interest expense.
Panoma Gas Gathering System (100% ownership MHR) • - 449 miles of pipeline • - 15.5 Mmcf per day throughput • McLean Gas Processing Plant (50% ownership MHR) • - Modern cryogenic gas processing plant • 980 barrels per day liquids production/23.0 Mmcf/D capacity • (65% utilized) • Walker Creek Processing Plant (15% ownership MHR) • - Propane refrigeration plant • - 240 barrels per day liquids/12Mmcf/D capacity • (35% utilized) • Madill Gas Processing Plant (50% ownership MHR) • - Modern cryogenic gas processing plant and gathering system • - 970 barrels per day liquids production/18Mmcf/D capacity • (78% utilized) • Elmore City Processing Plant (100% ownership MHR) • - Modern cryogenic gas processing plant and gathering system • - 980 barrels per day liquids production/35 Mmcf/D capacity • (30% utilized) • Acquire or build new systems to complement existing production • Seeking ways to monitize this asset base and continue in operating control Gas Gathering, Processing and Marketing Strategy
Revenues Operating Profit $140.6 $395.6 $325.0 $265.9 $92.7 $68.9 $152.8 $50.3 $48.1 $127.5 $69.6 $15.1 EBITDA Net Income $61.4 $251.2 $192.3 $155.3 $26.1 $22.3 $92.4 $15.5 $13.5 $75.9 37.2 ($6.8) Financial Performance (000’s) Note: Forward estimates for 2004 are derived from average consensus of the ten equity analysts that currently follow Magnum Hunter. The Benchmark Price Consensus from these analysts for 2004 is $5.38 per Mcf and /$30.76 per Barrel.
Natural Gas Price Commodity Hedges 2004 - 85 Mmcf/d at $3.76 - $5.78 per Mmbtu 2005 - 50 Mmcf/d at $4.05 - $6.32 per Mmbtu Oil Price Commodity Hedges 2004 - Collars 5,865 BOPD at $23.87 - $29.85 per Bbl 85 52% (i) 5,865 62% (i) 2004 50 2005 23% (ii) 0 0 (ii) Oil & Natural Gas Commodity Hedges Year Gas Mmcf % Hedged Oil Bbls % Hedged (i) Based on 2004 mid-point guidance (ii) Based on 2004 4th quarter mid-point guidance
Commodity Price Sensitivity 2004(i) 2005(ii) • $0.10 increase in gas price • Earnings per share $0.05 $0.05 • $1.00 increase in oil price • Earnings per share $0.03 $0.03 Note: (i) Based upon 2004 mid-point production guidance assuming $25 per barrel oil and $4 per Mcf gas and existing 2004 commodity hedges (ii) Based upon 2004 mid-point production guidance assuming $25 per barrel oil and $4 per Mcf gas and existing 2005 commodity hedges
Management’s Estimate of Magnum Hunter Net Asset Value * Based on 75.6 million fully-diluted common shares as of December 31, 2003.
Liquidity and Market Value Institutional Ownership = 59% of Float as of December 31, 2003 Thousands Millions $800 $726 MM $700 Compound Annual Market Capitalization Increase = 56% $600 $547 MM $500 $400 $300 $200 $78 MM $100 $0 * 2001 2002 2003 2004 2000 * As of April 12, 2004
Firm Analyst(s) Report Date Recommendation A. G. Edwards & Sons, Inc. Greg McMichael Chris Pikul 12/22/03 Buy/Speculative Lehman Brothers Jeffrey W. Robertson Michael A. Sullivan 11/05/03 Underweight (Company) Neutral (Sector) Friedman Billings Ramsey David M. Khani Frank M. Roebuck 03/04/04 Outperform Jefferies & Company, Inc Frank D. Bracken, III Leo P. Mariani 03/05/04 Buy Johnson Rice & Company L.L.C. Ronald E. Mills Ken Beers 03/05/04 Outperform Southwest Securities John Gerdes 03/05/04 Neutral Stanford Group Company Phil Dodge 03/09/03 Hold Deutsche Bank Securities Inc. John A. Bailey Neil P. Brown Jeffrey S. Wyll 03/04/04 Buy Raymond James & Associates, Inc. Wayne Andrews Jeffrey L. Mobley Pavel Molchanov 03/05/04 Strong Buy Equity Research Analyst Coverage
Note: Includes the effect of $6.50 warrants issued in 2000. Shareholders received one warrant for every three shares of Magnum Hunter common stock. Assumes warrants were sold at the average closing price for the first ten trading days ($0.89 per warrant). Also includes the effect of $15.00 warrants issued in 2002. Shareholders received one warrant for every five shares of Magnum Hunter common stock. Assumes warrants were sold at the average closing price for the first ten trading days ($1.12 per warrant). Shareholder Return $100,000 invested in Magnum Hunter at December 31, 1990, when the Company went public on the Boston Stock Exchange, would be worth approximately $4.3 million today. This calculates to an annual compounded return of 33% over the past 12 years (see Note). The Oil and Gas Journal recently ranked Magnum Hunter as the number one fastest-growing company based on growth in stockholders equity. Magnum Hunter’s stockholder equity nearly tripled last year from $118 million to $350 million. 33%
Investment Considerations • Diversified, long lived, and stable reserve base • Replaced 436% of last three years production at all sources finding and development cost of $1.22 per Mcfe • Large portfolio of low cost, low-risk exploitation projects located in core operating areas • Significant exploration potential with 232 OCS lease blocks in the Gulf of Mexico Shelf, 25 of which are Deep Shelf • Consistent balance sheet improvement • Experienced low cost operator with significant operating control • Three year growth in proved reserves per share of 15% compounded annually and increase in production per share of 9% compounded annually • Management team with significant ownership interest
Disclosure Regarding Forward-Looking Statements The information in this release includes certain forward-looking statements that are based on assumptions that in the future may prove not to have been accurate. Those statements, and Magnum Hunter Resources, Inc.’s business and prospects, are subject to a number of risks, including volatility of oil and gas prices, the need to develop and replace reserves, the substantial capital expenditures required to fund its operations, environmental risks, drilling and operating risks, risks related to exploration and development drilling, uncertainties about estimates of reserves, competition, government regulation, and the ability of the Company to implement its business strategy. These and other risks are described in the Company’s reports that are available from the SEC.