Download
1 / 46
460 likes | 484 Views
This workshop aims to help administrators, teachers, and parents understand how to use summative assessment results effectively. Participants will learn how to connect curriculum, instruction, and assessment, access supplementary resources, and reflect on current practices to improve teaching and learning.

E N D
Making Connections to Summative Assessment Results for Administrators, Teachers and Parents June 22, 2016
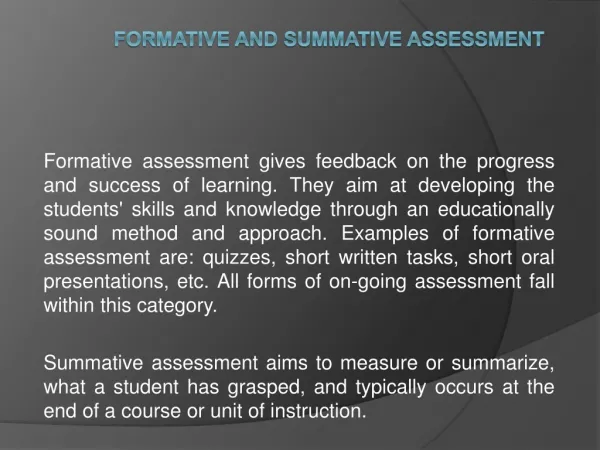
Workshop Goals Participants will learn: • the rightful place and purpose of the summative assessments • to use results to inform the instructional process by connecting curriculum, instruction and assessment • to access supplementary resources and reference materials to assist local training • to use tools to reflect on current practice to improve teaching and learning • a variety of ways to display data to communicate a particular message
A Balanced Assessment System Summative assessments benchmarked to college and careerreadiness (Grades 3–8 and Grade 11) Teachers and schools have information and tools to improve teaching and learning Standards set expectations on path to college- and career- readiness All students graduate college- andcareer-ready Digital Library Formative assessment tools and practices for teachers to improve instruction Interim assessments Flexible, open, and used for actionable feedback
Rightful Place/Purpose: Assessment Frequency and Impact on Instruction Statewide Summative Classroom Formative
Statewide summative assessments are like icebergs—it pays to pay attention
Rightful Place, Rightful Purpose for Statewide Summative Assessment • Provide a general direction—we must dig deeper to determine cause • Focus on groups, programs, and disaggregation • Rarely provide definitive answers, but raise many questions, allowing reflection on context and practice • Provide an entry point into a collaborative, honest conversation • Provide a necessary story
Using Summative Results • Comprehensive, complex, and difficult process • Not a checklist • Not meant to be completed at a single staff meeting or professional development event • Focus on improving learning • Not solely about increasing scores • Collaborative process that requires: • Honesty • Willingness to commit the time • Ability to handle ambiguity • Patience
. . . about the rightful place/purpose of summative assessment results • How do you currently use statewide summative assessment results in the curriculum, instruction, and assessment alignment process within your LEA? • What is the place and purpose of the summative assessment in your LEA right now?
TCDE Website Math and ELA ALD’s, Claims, and Targets http://tehamaschools.org/department/educational-support-services/CASSPP#
Available Summative Assessment Scores • Scale scores • Achievement levels • not met, nearly met, met, exceeded • Claim levels • below, near, above • Target scores • worse, similar, better • insufficient information
Scale Score – Achievement Level Relationship – Grade 3 Example
Smarter Balanced ELAThreshold Scale Scores http://www.cde.ca.gov/ta/tg/ca/sbelathresholdscre.asp
Low, Medium and High Bands (Divide the difference by three = 21 pts) (Divide the difference by three = 21 pts) 2367 to 2387 2388 to 2408 2409 to 2431 2432 to 2450 2451 to 2469 2470 to 2489 (Divide the difference by three = 21 pts) (Divide the difference by three = 21 pts) 2416 to 2433 2434 to 2452 2453 to 2472 2473 to 2491 2492 to 2511 2512 to 2532
Low, Medium and High Bands (cont.) 2015 2432 2016 2470
Comparing Year to Year http://www.cde.ca.gov/ta/tg/ca/caasppssrinfo.asp
Claim Scores: Example of a Claim Claims are broad, evidence-based statements about what students know and can do as demonstrated by their performance on the assessments. For example: English Language Arts/Literacy Claim #1 Students can read closely and analytically to comprehend a range of increasingly complex literary and informational texts. http://www.keydatasys.com/Content/images/EducationalResources/AllGradeLevelsELA.pdf
Use of Claim Scores • Reported at an individual and aggregate level • Reported for all claims in ELA and mathematics
Assessment Targets • Assessment targets connect the content standards to evidence that will be collected from the assessment. • Targets map the Common Core State Standards (CCSS) onto assessment evidence that is required to support the content categories and claims. • Targets are used to guide the development of items and tasks that will measure the CCSS.
Example of an Assessment Target (Grade 7 ELA Claim 1 Example) Target 1 Key Details: Identify explicit textual evidence to support inferences made or conclusions drawn.
Use of Target Scores • Reported at an aggregate level relative to group performance • Reported for all claims in ELA, but only for Claim 1 in mathematics • Only targets with 10 or more items in the item pool for a grade are included in target reports http://www.caaspp.org/rsc/pdfs/CAASPP.target-report-FAQs.2016.pdf
What’s one thing you will take away from this quick review of the scores? • What additional information do you need? . . . about the summative assessment scores
Tools for Analysis of the Smarter Balanced Summative Results
ELA—Example LEA Mean Scale Scores and Corresponding Achievement Levels by Grade
Research, Recall, Reflect, Respond Data review and discovery Possible actions moving forward Possible connections Program, practice, policies
Examples of Research Guiding Questions - Finding the Facts • What do you notice about the overall scores? • What are the percentages of students in each of the achievement levels? • Where do the scale scores fall, i.e., high, medium, low band? • How do the grade level scores compare with the Smarter Balanced threshold scores? • Which scores look most noticeably different from the population being studied?
Using the Resources to Research, Recall, Reflect, and Respond RESEARCH for SCALE SCORES and ACHIEVEMENT LEVELS The Spring 2015 CAASPP ELA summative test results for our LEA show that overall scale scores for every grade level fell into Level 2, Standard Nearly Met. Grade 8 and Grade 11 scale scores fell into the high band of Level 2; all other grades’ scale scores fell into the medium band of Level 2. Overall scale scores for Black or African American students in Grades 3 through 7 fell into Level 1, Standard Not Met. Overall scale scores for Black or African American students in Grade 8 and Grade 11 fell into Level 2. District wide, 5% of the Black or African American students’ scale scores fell into the Standard Exceeded level, with 15% falling into the Standard Met level. In comparison, 15% of the districts’ All Students’ scores fall into the Standard Exceeded level and 27% fell into Standard Met. The Spring 2015 CAASPP ELA summative test results for our LEA show that overall scale scores for every grade level fell into Level 2, Standard Nearly Met. Grade 8 and Grade 11 scale scores fell into the high band of Level 2; all other grades’ scale scores fell into the medium band of Level 2. Overall scale scores for Black or African American students in Grades 3 through 7 fell into Level 1, Standard Not Met. …
Using the Resources to Research, Recall, Reflect, and Respond RESEARCH for CLAIM SCORES The Spring 2015 CAASPP ELA summative test results for our LEA show that overall scale scores for every grade level fell into Level 2, Standard Nearly Met. Grade 8 and Grade 11 scale scores fell into the high band of Level 2; all other grades’ scale scores fell into the medium band of Level 2. Overall scale scores for Black or African American students in Grades 3 through 7 fell into Level 1, Standard Not Met. … Across all claims in ELA, fewer than 10% of all Black or African American students in Grades 3 through 7 had claim scores of Above Standard. Over 60% of the Grade 3 through Grade 6 students’ claim scores were at the Below Standard level. Across all claims in ELA, fewer than 10% of all Black or African American students in Grades 3 through 7 had claim scores of Above Standard. Over 60%...
Using the Resources to Research, Recall, Reflect, and Respond The Spring 2015 CAASPP ELA summative test results for our LEA show that overall scale scores for every grade level fell into Level 2, Standard Nearly Met. Grade 8 and Grade 11 scale scores fell into the high band of Level 2; all other grades’ scale scores fell into the medium band of Level 2. Overall scale scores for Black or African American students in Grades 3 through 7 fell into Level 1, Standard Not Met. … RESEARCH for TARGET LEVELS Target scores for the Spring 2015 CAASPP ELA summative test results for the Grade 3 Black or African American students indicate relative weakness in Key Details, Central Ideas, and Word Meaning. Across all claims in ELA, fewer than 10% of all Black or African American students in Grades 3 through 7 had claim scores of Above Standard. Over 60%... Target scores for the Spring 2015 CAASPP ELA summative test results for the Grade 3 Black or African American students indicate relative weakness in …
Recall RECALL Focusing on the prior school year(s), discuss the realities of classroom, school, district program, practice, and policies. What happened? Facts only – no conjecture. • Consider classroom program, practice and policies. • Think about last year: • What happened? • What curriculum was in place? • What professional learning occurred?
Examples of Recall Guiding Questions – What Happened? • What curriculum did we initiate/continue last year? • What professional development opportunities were available to teachers, administrators, and support staff? • What environmental factors were at play? • What changes occurred in our population? • What particular needs did our students exhibit?
Using the Resources to Research, Recall, Reflect, and Respond The Spring 2015 CAASPP ELA summative test results for our LEA show that overall scale scores for every grade level fell into Level 2, Standard Nearly Met. Grade 8 and Grade 11 scale scores fell into the high band of Level 2; all other grades’ scale scores fell into the medium band of Level 2. Overall scale scores for Black or African American students in Grades 3 through 7 fell into Level 1, Standard Not Met. … Over 30% of our elementary teachers retired at the end of the previous school year, and many of the new teachers were unfamiliar with the district’s materials. We had new principals at all but two of our schools. We implemented a new student information system, district wide. We implemented a new mathematics curriculum in Grades K through 6. RECALL Over 30% of our elementary teachers retired at the end of the previous school year, and many of the new teachers were unfamiliar with the district’s materials. All of our professional learning opportunities were focused on ELA. We implemented a new student information system, district wide. We implemented a new mathematics curriculum in Grades K through 6. Across all claims in ELA, fewer than 10% of all Black or African American students in Grades 3 through 7 had claim scores of Above Standard. Over 60%... Target scores for the Spring 2015 CAASPP ELA summative test results for the Grade 3 Black or African American students indicate relative weakness in …
Resources Evidence Required for Target 1 The student will identify text evidence (explicit details and/or implicit information) to support a GIVEN inference or conclusion based on the text. • What should our students know or be able to do? • What are the expectations of our students, based on the range and threshold descriptors? Reflect: possible connections Recall: program, practice, policies
Using the Tools to Research, Recall, Reflect, and Respond At Grade 3: Students performing at Level 3 should be able to use explicit details and information from the text to support answers or basic inferences in texts of moderate-to-high complexity. Students performing at Level 3 should be able to identify or summarize central ideas, key events, or the sequence of events presented in texts of moderate-to-high complexity. Students performing at Level 3 should be able to determine intended meanings of words, including words with multiple meanings, based on context, word relationships, word structure, or use of resources in texts of moderate-to-high complexity. RESOURCES The Spring 2015 CAASPP ELA summative test results for our LEA show that overall scale scores for every grade level fell into Level 2, Standard Nearly Met. Grade 8 and Grade 11 scale scores fell into the high band of Level 2; all other grades’ scale scores fell into the medium band of Level 2. Overall scale scores for Black or African American students in Grades 3 through 7 fell into Level 1, Standard Not Met. … Over 30% of our elementary teachers retired at the end of the previous school year, and many of the new teachers were unfamiliar with the district’s materials. We had new principals at all but two of our schools. We implemented a new student information system, district wide. We implemented a new mathematics curriculum in Grades K through 6. At Grade 3: Students performing at Level 3 should be able to use explicit details and information from the text to support answers or basic inferences in texts of moderate-to-high complexity. Students performing at Level 3 should be able to identify or summarize central ideas, key events, or the sequence of events presented in texts of moderate-to-high complexity. Students performing at Level 3 should be able to determine… Across all claims in ELA, fewer than 10% of all Black or African American students in Grades 3 through 7 had claim scores of Above Standard. Over 60%... Target scores for the Spring 2015 CAASPP ELA summative test results for the Grade 3 Black or African American students indicate relative weakness in …
Reflect REFLECT Connect performance with prior year practices, programs, and policies. Consider possible reasons. Be honest about what occurred last year and how that may have impacted the performance that you observe. • Use the guiding questions. • Determine possible reasons for the performance. • Keep the conversation honest. • Explore many possibilities.
Examples of Reflecting Guiding Questions – Why and how may it have happened? • How do these results affirm areas where instruction was provided? • What would you consider is the single-most important factor contributing to the apparent successes/needs as indicated by the scores? • Consider what might explain these gaps in achievement. Think about current: • Policies • Programs • Practices
Reflecting—Beyond the Numbers Example Reflection Template
Respond • Use guiding questions. • Think about what you can control. • Ask yourself: • What other data are available to you? • How will you know progress is being made? RESPOND What might be some possible ways to move forward? These responses should tie directly to what was discovered in the reflection process.
Examples of Responding Guiding Questions – What’s our path forward? • How might we need to alter our curriculum and/or materials to address the areas of need for the coming year? • What evidence do we need during classroom instruction to know that our students are making progress toward meeting the targets for each claim? • How might we use the performance tasks to illustrate student performance and to guide the possible intervention?
Start thinking about how you might weave these documents into planned professional learning, instructional planning, and local assessment development in the coming school year… . . . about the documentswe’ve just reviewed.
CAASPP Resources http://tehamaschools.org/department/educational-support-services/CASSPP#