Download
1 / 8
90 likes | 238 Views
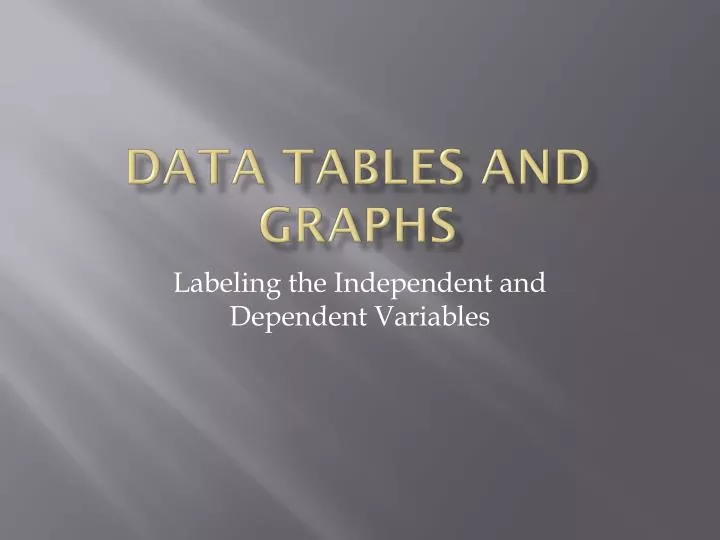
Data Tables and Graphs. Labeling the Independent and Dependent Variables. The independent (manipulated) variable is labeled in the left side of the data table. Independent Variable Written Here. The dependent (responding) variable is labeled on the right side of the date table.

E N D
Data Tables and Graphs Labeling the Independent and Dependent Variables
The independent (manipulated) variable is labeled in the left side of the data table Independent Variable Written Here
The dependent (responding) variable is labeled on the right side of the date table Dependent Variable Written Here
A scientist set up 4 groups of seeds. The water used on each group had a different pH: 5.6, 4.0, 3.0 and 2.0. After 10 days the number of seeds that germinated in each group was counted. What should the titles of the data table be? ? ? pH of water Number of seeds germinated
The concentration of salt in water affects the number of brine shrimp that hatch. A scientist set up 3 containers with different concentrations of salt water: 2%, 4% and 6%. After one week the number of brine shrimp in each container was counted. What should the titles of the data table be? ? ? Concentration of Salt Water Number of Brine Shrimp Hatched
Labeling Axes on a Graph Dependent Variable Independent Variable
pH of water Number of seeds germinated Number Of Seeds Germinated pH of water
Concentration of Salt Water Number of Brine Shrimp Hatched Number of Brine Shrimp Hatched Concentration of Salt Water