Download
1 / 12
120 likes | 304 Views
Bayesian Graphical Models for Software Testing David A Wooff, Michael Goldstein, Frank P.A. Coolen. Presented By Scott Young. Applying Detailed Metrics to Testing. Can provide insight for performing risk analysis

E N D
Bayesian Graphical Models for Software TestingDavid A Wooff, Michael Goldstein, Frank P.A. Coolen Presented By Scott Young
Applying Detailed Metrics to Testing • Can provide insight for performing risk analysis • Can provide concrete values to inform the customer or management, concerning software quality • May result in more efficient testing procedures
Meaningful Metrics • Simple metrics concerning testing can inform concerning the success of the testing process • They also can provide insight for when the test process is reaching completion • More complex testing analysis needs to be done in order to locate points of inefficiency in testing, as well as providing more fine-grained knowledge about test results
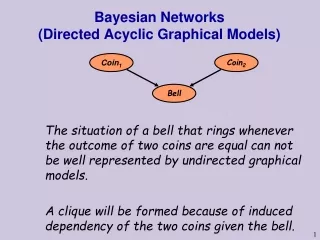
What is a Bayesian Graphical Model? • Also commonly called a Bayesian Belief Network • Is a directed graph, with nodes signifying indeterminate factors • Bayesian models are most commonly heard of today in relation to email spam filtering • They are used to calculate probability based on pre-defined knowledge and relationships between components
Software Actions (SA’s) • A Software Action is an individual, fine grained component of the software project which accomplishes a single task. • An example of a software action in a system would be the processing of a credit card number.
Specifying Nodes • A node should be a collection of operations with the same prior probability of failure, as well as the same change in probability of failure given a test covering that set of operations.
Factors For Defining Probabilities • Level of code complexity • Reliability comparison with existing code which has been evaluated • Maturity of codebase • Typical reliability of author’s code • Similarities to existing code
Updating The Model • As testing continues, the model must be update in stepwise fashion to follow changes to components as they occur. • The probability of an individual node can be updated according to multiple criteria (which are necessarily assumptions) about remaining defects.
What The Results Provide • Tests should be arranged according to the software action(s) which they provide coverage for. Tests discovered to be redundant may be safely removed • Results demonstrate the perceived probability (or strength of belief/confidence) that there are no more existing faults within each SA
What Does This Mean For V&V? • Software producers can demand a level of confidence for components from their testing according to the role of the software and potential financial impact of defects in specific components.
Drawbacks • Informed knowledge is required in order to build a reliable model • This “informed knowledge” still consists of assumptions of relationships (though an assumption within an order of magnitude can still provide useful results) • The amount of additional work to formally track every SA may be prohibitive
Resources • David A Wooff, Michael Goldstein, Frank P.A. Coolen, “Bayesian Graphical Models for Software Testing”. IEEE Transactions on Software Engineering, May 2002. • Murray Cumming, “Bayesian Belief Networks”. http://www.murrayc.com/learning/AI/bbn.shtml Date unknown. • Kevin Murphy, “A brief introduction to Bayes’ Rule”. http://www.ai.mit.edu/~murphyk/Bayes/bayesrule.html, Jan 2004.