Download
1 / 24
240 likes | 444 Views
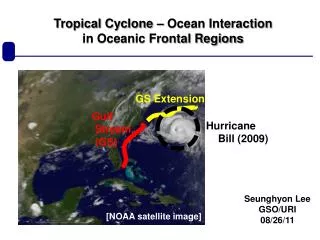
Ocean frontal-scale air-sea interaction. A Subgroup of the CLIVAR Working group on Western Boundary Current Ocean-Atmosphere Coupling Participants: Bond, Cronin, Kelly, Samelson, Small, Thompson. Some questions. On what scales do ocean and atmosphere interact near WBCs?

E N D
Ocean frontal-scale air-sea interaction A Subgroup of the CLIVAR Working group on Western Boundary Current Ocean-Atmosphere Coupling Participants: Bond, Cronin, Kelly, Samelson, Small, Thompson
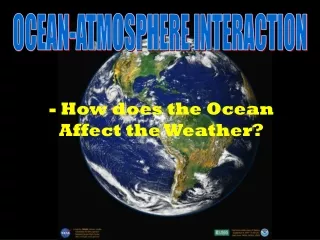
Some questions • On what scales do ocean and atmosphere interact near WBCs? • How do Gulf Stream and Kuroshio compare? • Are models (global and/or regional) getting the interaction right? • To what depth in atmosphere does effect extend? • How do storms respond to SST fronts? Does this feedback onto mean circulation?
Overview • Analysis of synoptic storms and the Gulf stream by Kelly, Thompson et al • Regional modeling of atmospheric response to Gulf Stream by Small et al • Tropical-extratropical cyclone transitions – Bond and Cronin • Air-Sea coupling in coastal upwelling by Samelson et al
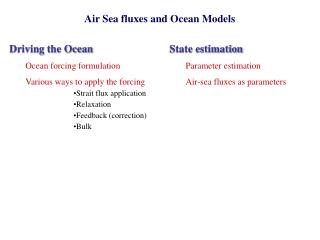
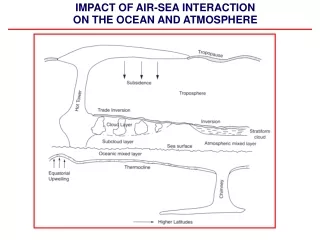
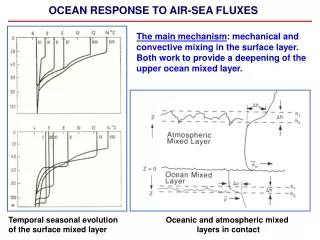
Response of MABL to ocean fronts • 2 ways MABL may respond: • 1. Directly, via influence of surface fluxes on MABL only • Heat fluxes alter thermodynamic structure, stratification, clouds etc. • Momentum mixing and pressure anomalies alter wind profile • 2. Indirectly, via influence of surface fluxes on extratropical storms which will then change boundary layer (and much deeper) properties
Analysis of synoptic storms and Gulf Stream Kathie KellyLuAnne ThompsonJimmy BoothJerome Patoux University of Washington , Seattle
Intensity of Storms Passing over the Gulf Stream Histogram of storm intensity Storms passing to the north of the Gulf Stream (red) are more intense than those passing to the south (green) Jones, Kelly, Patoux, & Thompson University of Washington
Storm Tracks and the North Atlantic Oscillation Storms that occurred in DJFM that passed through the box (dashed line) NAO strongly negative NAO strongly positive Booth, Kelly, Patoux, & Thompson University of Washington
Regional atmospheric modeling of response to Gulf Stream R. Justin Small, Yuqing Wang, Shang-Ping Xie International Pacific Research Center, University of Hawaii
Regional Atmospheric Modeling • Regional Atmospheric Model of Yuqing Wang (IPRC) • Hydrostatic, sigma coordinate, primitive equation • Lateral boundary conditions NCEP/NCAR reanalysis • ½ degree and 1/3 degree simulations, 28 vertical levels • Surface boundary conditions daily evolving AMSR SST • Run for up to 4 months of winter season, Jan-April 2003 • ****Previous high-resolution studies of atmospheric and storm response over Gulf Stream just consider a few case studies and short time periods –here we extend this to 4 months – to get reliable statistics (mean and synoptic variance).
Rain rate and deep response • Hobbs (GRL, 1987) introduced the ‘Gulf Stream Rainband’, a quasi-stationary band with associated lightning strikes. Trunk and Bosart (1990) mapped the mean radar echos off Cape Hatteras to confirm.
Synoptic variability: 2-8 day bandpass MODEL OBSERVATIONS CLOSE-UP CLOSE-UP
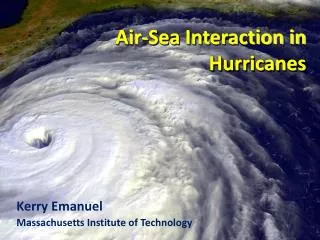
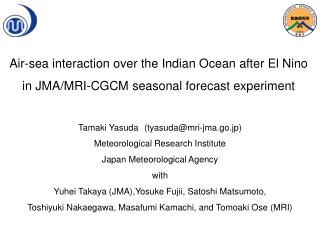
Tropical-Extratropical Cyclone TransitionsNick Bond -- University of Washington JISAOMeghan Cronin -- NOAA Pacific Marine Environmental Laboratory • Common in western North Pacific and western North Atlantic • Source of substantial forecast uncertainty regionally and far downstream • Focus for THORPEX in terms of targeted atmospheric observations • Potentially sensitive to underlying ocean; to be assessed in upcoming NWP experiments on recent western Pacific events
General Decrease in Forecast Skill for ET Storms ET Tracks Forecast Skill Bifurcation From Jones et al., 2003: Wea. And Forecasting
19 Oct 27 Oct Tokage- Downstream Increase in Uncertainty ECMWF EPS 500 hPa Standard Deviation Forecast from 16 October Forecast from 18 October 17 Oct 25 Oct 0 0 0 180 0 180 Hovmoller diagrams of the standard deviation in 500 mb geopotential height among the individual members of an ensemble of ECMWF model forecasts. The rate of spread in the forecasts (i.e., error growth) becomes relatively large near the time of Tokage’s transition. From a presentation for the Pacific Asian Regional Campaign (PARC-2008) at the NOAA THORPEX PI meeting, 19 Jan 2006, NCEP
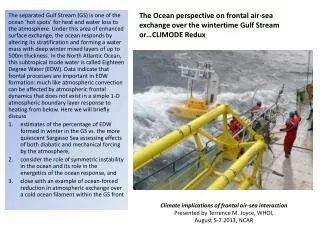
Coastal Boundary Layer Air-Sea Coupling in Coastal UpwellingRoger Samelson, Eric Skyllingstad, Natalie PerlinCOAS, Oregon State University Reduced SAT and Winds
Numerical Simulations of Air-Sea CouplingDuring Coastal Upwelling (Perlin et al., JPO, 2007) Idealized two-dimensional (cross-shore and vertical) simulations of wind-driven coastal upwelling Atmosphere: 15 m/s northerly geostrophic wind Ocean: Stratified, at rest Sloping bathymetry 72-hour coupled and uncoupled simulations Initial model atmospheric potential temperature, water vapor mixing ratio, and ocean temperature and salinity profiles Ocean bathymetry
Coastal Boundary Layer Warm, offshore flow Heat Cooling ~10-30 km
from Long-EZ, November 14, 1999 Vickers et al. (2001) Aircraft Data Momentum flux (u*, shaded) Offshore velocity (u, solid contours) Coast
COAMPS Barrier Island Simulation Turbulent Kinetic Energy Neutral Heating Cooling q = 293 q = 283 q = 287
offshore velocity (u) momentum flux (u*) Barrier Island flow: models vs. observations COAMPS LES Observations