Download
1 / 14
140 likes | 257 Views
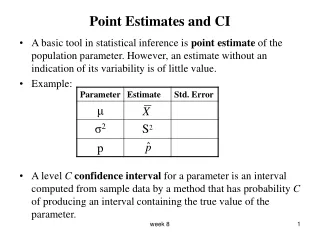
Point Estimates. A point estimate is a single number determined from a sample that is used to estimate the corresponding population parameter. Confidence Intervals. Confidence Interval Developed from a sample. Provides a range of likely values for a parameter.

E N D
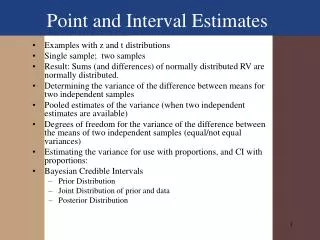
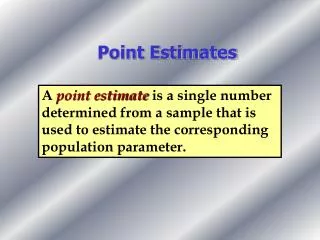
Point Estimates A point estimate is a single number determined from a sample that is used to estimate the corresponding population parameter.
Confidence Intervals Confidence Interval Developed from a sample. Provides a range of likely values for a parameter. Expresses the confidence level that the true population parameter is included.
Confidence Intervals Lower Confidence Limit Upper Confidence Limit Point Estimate
95% Confidence Intervals(Figure 7-3) 0.95 z.025= -1.96 z.025= 1.96
Confidence Interval- General Format - Point Estimate (Critical Value)(Standard Error)
Confidence Intervals The confidence level refers to a percentage greater than 50 and less than 100. For a given size sample it is the percentage that the interval will contain the true population value.
Confidence Interval Estimates CONFIDENCE INTERVAL ESTIMATE FOR ( KNOWN) where: z = Critical value from standard normal table = Population standard deviation n = Sample size
Example of a Confidence Interval Estimate for A sample of 100 cans, from a population with = 0.20, produced a sample mean equal to 12.09. A 95% confidence interval would be: 12.051 ounces 12.129 ounces
Margin of Error The margin of error is the largest possible sampling error at the specified level of confidence.
Margin of Error MARGIN OF ERROR (ESTIMATE FOR WITH KNOWN) where: e = Margin of error z = Critical value = Standard error of the sampling distribution
Example of Impact of Sample Size on Confidence Intervals If instead of sample of 100 cans, suppose a sample of 400 cans, from a population with = 0.20, produced a sample mean equal to 12.09. A 95% confidence interval would be: 12.0704 ounces 12.1096 ounces n=400 n=100 12.051 ounces 12.129 ounces
Student’s t-Distribution The t-distribution is a family of distributions: Bell-shaped and symmetric Greater area in the tails than the normal. Defined by its degrees of freedom. The t-distribution approaches the normal distribution as the degrees of freedom increase.
Confidence Interval Estimates CONFIDENCE INTERVAL ( UNKNOWN) where: t = Critical value from t-distribution with n-1 degrees of freedom = Sample mean s = Sample standard deviation n = Sample size
Confidence Interval Estimates CONFIDENCE INTERVAL-LARGE SAMPLE WITH UNKNOWN where: z =Value from the standard normal distribution = Sample mean s = Sample standard deviation n = Sample size