Download
1 / 35
370 likes | 492 Views
Augmenting the Generalized Hough Transform to Enable the Mining of Petroglyphs. Qiang Zhu , Xiaoyue Wang, Eamonn Keogh, 1 Sang-Hee Lee Dept. Of Computer Science & Eng., 1 Dept. of Anthropology University of California, Riverside. Outline. Motivation Approach Evaluation Conclusion.

E N D
Augmenting theGeneralized Hough Transform to Enable the Mining of Petroglyphs Qiang Zhu, Xiaoyue Wang, Eamonn Keogh, 1Sang-Hee Lee Dept. Of Computer Science & Eng., 1Dept. of Anthropology University of California, Riverside
Outline • Motivation • Approach • Evaluation • Conclusion
Motivation(1) -applications • Petroglyphs are one of the earliest expressions of abstract thinking. • Providing a rich source of information: • climate change • existence of a certain species • patterns of human’s migrations and interactions
Motivation(2) -difficulties • Progress in petroglyph research has been frustratingly slow. • due to their extraordinarily diverse and complex structure • most matching algorithms can not capture the similarity of petroglyphs • for those that can, even in limited cases, do not scale to large collections
Approach • How to preprocess the raw data? • How to define the distance measure? • How to speed up?
Preprocessing(1) • With rare exceptions, petroglyphs do not lend themselves to automatic extraction with segmentation algorithms. The border of this rock may be recognized as the edge of this petroglyph
PetroAnnotator Load the raw image into our human computation tool
PetroAnnotator (cont.) Draw an approximate boundary around object, and then trace the shape
B Preprocessing(2) -downsampling A • Two overlaid skeleton traces (340 by 250) of the same image of a Bighorn sheep. Less than 3.5% of the pixels from each image overlap. (B) The same two images after downsampling (30 by 23). 75.6% of the pixels (denoted by black) are common to both.
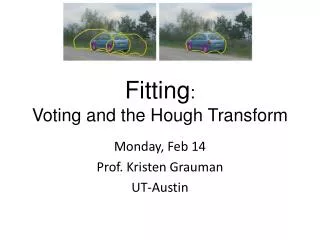
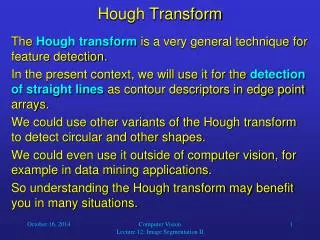
Distance Measure -why GHT? • essentially makes no assumption about the data • open/closed boundaries • connected/disconnected shapes • correctly captures the similarity • subjective/objective similarity on unlabeled/labeled datasets • tightly lower bound the distance • allowing for very efficient searches in large datasets
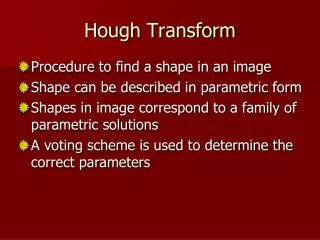
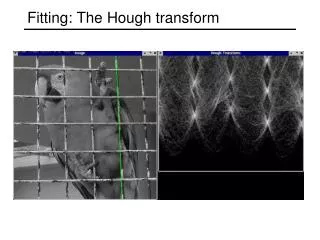
Q C Classic GHT GHT is a useful method for two dimensional arbitraryshape detection.
R R (1) Find the “star-pattern”
C A 0 1 0 0 0 0 0 0 1 0 0 1 0 0 1 0 1 0 1 0 0 2 1 1 0 2 1 0 2 1 0 0 0 0 2 0 1 1 0 0 3 0 1 3 0 1 1 1 0 0 0 0 2 0 1 0 0 1 0 0 1 2 0 1 0 0 0 0 0 0 0 1 0 0 0 0 1 0 0 0 (2) Superimpose & Accumulate
C (3) Find the “peak” Q R’ R 0 1 1 1 0 A 0 0 1 0 0 1 2 3 2 1 0 1 1 1 0
A Basic Distance Measure • Classic GHT doesn’t explicitly encode a similarity measure • We can simply define a GHT-based distance: minimal unmatched edge points (MUE) = number of edge points in Q – maximal matched edge points = 4 – 3 = 1 (forour toy example)
Q C A New Cell Incrementation Strategy • When can we obtain the value of a particular cell in the accumulator? • In the classic GHT, until the end of all incrementation • Is it possible to obtain the value one by one? • Need to check all positions that are possible to increase the cell value ?
2 2 2 2 4 4 2 2 2 2 SigQx = SigCx = 0 0 0 3 2 2 2 3 0 0 0 Lower Bound ? Q C ? ? ? ? ? ? ? ? In this column Q needs 2 pixels in C, and has 3 In this column Q needs 2 pixels in C, and has 2 In this column Q needs 4 pixels in C, and has only 2 In this column Q needs 2 pixels in C, and has 2 In this column Q needs 2 pixels in C, and has 3 Minimal missed points: = 2 0 + 0 + 2 + 0 + 0
Time Complexity • Classic GHT • O(NQ×NC+S2) • superimpose all query vectors to all edge points in the candidate image • Lower bound GHT • O(S2) • compare one-dimensional signatures • further reduced by early abandon and shifting order • one to two orders of magnitude speed-up
Variants on the Basic Distance Measure • Query-by-Content: • Clustering: • Finding Motifs:
Evaluation We performed three sets of experiments: • Evaluation of Utility -on unlabeled data • Evaluation of Accuracy -on labeled data • Evaluation of Scalability -on synthetic data
Evaluation of Utility (1) • Our GHT-based distance measure correctly groups all seven pairs • The higher level structure of the dendrogram also correctly groups similar petroglyphs Atlatls Anthropomorphs Bighorn Sheep A clustering of typical Southwestern USA petroglyphs
g a b c d e f h SC WY Evaluation of Utility (2)
0 50 100 150 200 Evaluation of Utility (3) • Whether our distance measure can find meaningful motifs? • 2,852 real petroglyphs • 4,065,526 possible pairs • 52 top motifs (0.00128%) by motif cutoff Motif Cutoff
NicIcon dataset 24,441 images 14 categories 33 volunteers 234×234 pixels WD/WI tests Farsi digits dataset From 11,942 registration forms 60,000 digits for training 20,000 digits for testing 54×64 pixels (largest MBR) 0 1 2 3 4 5 6 7 8 9 Evaluation of Accuracy -datasets
(1) Test the Downsampling Size 30 20 Error Rate (%) WD In both datasets, the error rate of one-nearest-neighbor test varies little once the resolution is greater than 10×10 10 WI 0 5 10 20 30 40 50 60 70 80 Resolution (R×R) of Downsampled Images (NicIcon) 16 12 Error Rate (%) 8 4 2 5 10 20 30 Resolution (R×R) of Downsampled Images (Farsi)
NicIcon dataset Error rate for WD: 4.78% 8.46% for WI The dataset creators tested on the online data using three classifiers. Only one of them (DTWB) is better, however, slower Farsi digits dataset Error rate: 4.54% Borji et al. performed extensive empirical tests on this dataset Of the twenty reported error rates, the mean was 8.69% Only four beat our approach, but need to set at least six parameters (2) Competitive accuracy
Evaluation of Scalability -datasets • We made 8 synthetic petroglyph datasets • Based on 22 classic petroglyphs • Duplicated by 10 volunteers on a tablet • Applied a Random Polynomial Transformation • Containing up to 1,280,000 objects
100 80 Prune Rate (%) Max Prune Rate 60 Avg Prune Rate Min Prune Rate 40 10K 20K 40K 80K 160K 320K 640K 1280K Size of Synthetic Petroglyphs Datasets 18 14 % to Brute Force Time 10 6 2 10K 20K 40K 80K 160K 320K 640K 1280K Size of Synthetic Petroglyphs Datasets (1) Querying by Content • Leave-one-out one-nearest-neighbor test. • Repeated the test for 10 times on each dataset.
120000 80000 Speed Up (times) 40000 0 10K 20K 40K 80K 160K 320K 640K 1280K Size of Synthetic Petroglyphs Datasets (2) Finding Motifs • A brute force algorithm requires time quadratic in the size of dataset. • By using the triangular inequality of our distance measure, we only need to calculate a tiny fraction of the exact distance. • Even for the smallest dataset: -our algorithm is 712 times faster -we can prune 99.84% of the calculations
Conclusion • In this work we considered, for the first time, the problem of mining large collections of rock art. • Introduced a novel distance measure • Found an efficiently computable tight lower bound to this measure • Enabled mining large data archives effectively
All datasets and the code can be downloaded from: http://www.cs.ucr.edu/~qzhu/petro.html Thanks for your listening !
Preprocessing • With rare exceptions, petroglyphs do not lend themselves to automatic extraction with segmentation algorithms. Cracks in the rock are more “significant” than the actual edges
From a scanned book Binarized Thinned Downsampled Preprocessing -existing archives • There are several other rich sources of rock art data to be mined, e.g.: sketches by anthropologists
By Hausdroff By GHT • Experiment testing the impact of noise, a single dot is randomly added