Download
1 / 18
180 likes | 248 Views
Explore the changes in atmospheric moisture recycling rate over two decades in response to global warming. New data and results show varying trends in precipitation, water vapor, and recycling rate, impacting regions differently. Positive and negative trends observed in high and low precipitation areas suggest intensified extreme weather linked to climate change.

E N D
The Recycling Rate of Atmospheric Moisture Over the Past Two Decades (1988-2008) Liming Li, Moustafa Chahine, Edward Olsen, Eric Fetzer, Luke Chen, Xun Jiang, and Yuk Yung NASA Sounding Science Meeting, April, 2010
Overview • Motivation • Data • Revisit Previous Studies • New Results • Conclusions
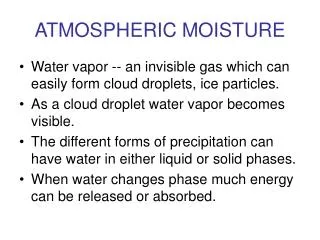
Motivation • Recycling rate (or residence time) of atmospheric moisture is an important index of climate change. • How does recycling rate change in response to global warming?
> 0 > 0 < 0 < 0 or or or or < 1 > 1 < 1 > 1 when when > < Background Definition (Chahine et al., 1997) R: recycling rate; P: precipitation; W: column water vapor (Stephens and Ellis, 2008) Some model studies suggest A recent observational study (Wentz et al., 2007) suggests
Data Sets • Precipitation (P) GPCP (V2 and V2.1) 2.5º× 2.5º global monthly precipitation (1988-2008) SSM/I (V5) 0.25º× 0.25º oceanic monthly precipitation (1988-2008) • Column Water Vapor (W) SSM/I (V5) 0.25º× 0.25º oceanic monthly precipitation (1988-2008) AIRS (V5) 1º× 1º global monthly data (2002-2008) NVAP 1º× 1º global monthly data (1988-2001) • Temperature (AT and SST) NCEP2 2.5º× 2.5º global monthly atmospheric temperature (AT) (1988-2008) NOAA 2º× 2º monthly sea surface temperature (SST) (1988-2008)
? 0 ≥ 0 or or ≥ 1 ? 1 Revisit Previous Study (Precipitation) Based on the old version data sets (GPCP V2 and SSM/I V4), Wentz et al. (2007) got (1988-2006) (globe) = 1.40.5%/decade (ocean) = 1.20.4%/decade Examination with new version data sets (GPCP V2.1 and SSM/I V5) GPCP V2 1.30.6%/decade GPCP V2.1 0.30.5%/decade GPCP V2.1 - 0.30.6%/decade + SSM/I V5
Precipitation Over Ocean * High-quality data sets over ocean between 60N and 60S. * Coast regions are excluded from this study. Nino 3.4 Index GPCP V2.1 0.07±0.7%/decade Raw Data SSM/I V5 -0.6±1.5%/decade GPCP V2.1 0.13±0.6%/decade Removing ENSO SSM/I V5 -0.4±0.9%/decade * Precipitation is correlated with ENSO signals. * No significant trend in ocean-average precipitation during 1988-2008.
Water Vapor Over Ocean 0.9±0.5%/decade raw data Water vapor trend over ocean remove ENSO 1.0±0.4%/decade * A positive trend in ocean-average water vapor during 1988-2008. ( per decade , roughly same as per decade during 1988-2006 (Santer et al., 2007)).
Recycling Rate Over Ocean Trend of Recycling Rate (R) P (GPCP) / W (SSM/I) -0.9±0.7%/decade Raw Data P (SSM/I) / W (SSM/I) -1.4±1.3%/decade P (GPCP) / W (SSM/I) -0.9±0.6%/decade Removing ENSO P (SSM/I) / W (SSM/I) -1.2±0.9%/decade * A weak negative trend in ocean-average recycling rate, which means: < 0
Spatial Pattern (Precipitation) SSM/I V5 P GPCP V2.1 P Time-mean State Linear Trend * Positive trend in strong precipitation regions (ITCZ). * Negative trend in some weak precipitation regions.
Spatial Pattern (Water Vapor) SSM/I V5 Water Vapor Time-mean State Linear Trend
Spatial Pattern (Recycling Rate) P (GPCP) / W (SSM/I) P (SSM/I) / W (SSM/I) Time-mean State Linear Trend * Positive trend in high recycling-rate areas over tropical ocean (ITCZ).
ITCZ Area (Definition) SSM/I V5 GPCP V2.1 ITCZ Low Precipitation Area
ITCZ Area (Precipitation) Raw Data Removing ENSO Precipitation Trend GPCP V2.1 3.1±1.5%/decade ITCZ area: SSM/I V5 2.5±1.6%/decade GPCP V2.1 -6.5±4.5%/decade Low-P area: SSM/I V5 -7.7±5.6%/decade * Strong El Nino (97-98) critically affects precipitation. * Positive precipitation trend in ITCZ; Negative trend in low-P area.
ITCZ Area (Water Vapor) Water Vapor Trend ITCZ: 1.5±0.6%/decade Low-P area: 0.6±0.6%/decade * Positive water-vapor trend in ITCZ area. * Strong El Nino events (i.e., 1997-98) affects water vapor in low-P areas.
ITCZ Area (Recycling Rate) Removing ENSO Raw Data Recycling Rate Trend P(GPCP)/W(SSM/I) 1.7±1.1%/decade ITCZ area: P(SSM/I)/W(SSM/I) 0.8±1.3%/decade P(GPCP)/W(SSM/I) -5.8±3.5%/decade Low-P area: P(SSM/I)/W(SSM/I) -8.7±5.1%/decade * Weak positive recycling-rate trend in ITCZ area and negative trend in low-P area. * Strong El Nino (i.e., 1997-98) affects tropical recycling rate.
Conclusions • New Precipitation (P) data suggest a much weaker trend. Lack of long-term continuous water-vapor (W) data over land make it hard to estimate global recycling rate. • Over the ocean, consistence between GPCP V2.1 and SSM/I V5 suggests a negative trend in spatial-average recycling rate (R). • However, positive trends of P, W, and R are detected in high-P area (ITCZ), and negative trends of P and R are detected in low-P area.It suggests that extreme weather intensified along global warming during the past two decades. • Strong El Nino (i.e., 1997-98) critically modify hydrological cycle over tropical region (need more observations).
Acknowledgement • SSM/I • GPCP (David Bolvin and Phillip Arkin) • NVAP (Janice Bytheway, Tomas Vonder Haar, and John Forsythe) • NCEP2 and NOAA