Download
1 / 53
540 likes | 734 Views
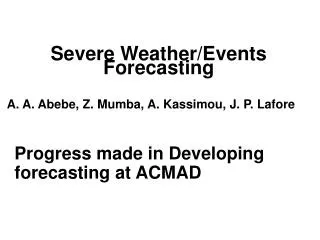
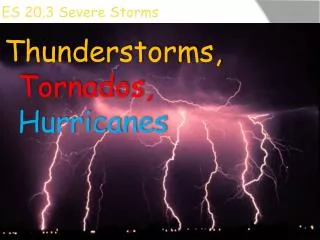
Day 1 Severe Storms Forecasting. Jim LaDue – WDTB 08 June, 2005. Topics. Use today’s example to discuss 2-8 hour severe storms forecast strategies Convective forcing – lines vs. isolated Convective mode If isolated, what type? If a line, what type? Hazards type? Timing –

E N D
Day 1 Severe Storms Forecasting Jim LaDue – WDTB 08 June, 2005
Topics • Use today’s example to discuss 2-8 hour severe storms forecast strategies • Convective forcing – lines vs. isolated • Convective mode • If isolated, what type? • If a line, what type? • Hazards type? • Timing – • When is initiation likely?
General philosophy • Diagnose the current weather with real observations first • Then compare reality to what the model analyzed • Then use the model and your understanding of its errors to make a prognosis.
look for forcing mechanisms to destabilize the atmosphere Next look for low-level triggering mechanisms A simple methodology for convective initiation Analyze regions of potential Convective instability After that is figuring what stormtype there’ll be.
Forcing mechanisms • What fits your conceptual model best?
Short-wave forcing • 500 mb Q-vectors
Synoptic forcing mechanisms • Complications of playing the jetstream game Ascent only where the red dots are located Cyclonic curved jet anticyclonic curved jet
Playing the jet game isn’t as critical with a bowling ball low
Forcing contd • Vertical motion from the RUC • Vertical motion acts to remove the CAP • Not the only type of CAP remover
Differential thermal advection • Warm advection down below or • Cold advection up above • Bottom line, the sounding destabilizes
Differential thermal advection • 700mb cooling
Differential thermal advection/heating • 850mb • Ascent cooling • Compensated by solar heating
Bottom line? • Note lifting of the CAP at FWD
Low-level forcing mechanisms • Low-level frontogenesis • How deep is it? • Dryline • Poor at forcing CI • That’s good • Any other troughs?
Deep frontogenesis • Shows up from surface past 850 mb
Convective forcing summ frontogenesis DPVA WAA
Forcing, now coverage • CI is underway. The strongest forcing areas will most likely generate linear modes • But geometry of forcing, especially with boundaries is important
Boundary geometry • Things to consider • Boundary-relative steering layer flow • Boundary-relative anvil-layer flow • Shear relative to lines of forcing
Boundary-relative steering layer flow • Promotes more initiation if this value is small • Can be good if CIN is a problem • Too little CIN with forcing and this can be a problem
Storm motion Boundary-relative storm motion Boundary motion Boundary-relative Flow Parameters Boundary-relative flow Flow
Effects of Boundary-relative kinematics on storm morphology • Steering flow stable unstable Is the storm going to remain on, fall behind or overtake a boundary? This may affect storm type beyond CAPE and shear
Boundary-relative anvil-layer flow • If parallel to a line of forcing: • This can promote interstorm seeding and cold pool development • If directed ahead of a the forcing line • Limits cold pool development greater chance of isolated modes • If directed behind line of forcing • Depends but it can promote a rear inflow jet
LM RM Effects of Boundary-relative kinematics on storm morphology • Shear Shear vector
Now given your expected coverage are likely, what are the threats? • Severe winds, • Severe hail • Tornadoes • Heavy rain
Ingredients for supercells and severe squall lines/bow echoes • Deep moist convection (CAPE> a few hundred j/kg) • Strong vertical wind shear • Best represented by 0-6 km bulk shear • Subtract the winds at 6 km from the boundary layer • Can be represented by Bulk Richardson Number Shear or BRN shear = 0.5 (Uavg)2where Uavg is the difference from the mean 0-6 km wind and the mean wind in the lowest 500 m.
Do I have enough shear? If I have around 18 m/s (35 kt) of shear between 500 mb and close to the ground. Just eyeballing 500mb, look for at least 30kt in the lower plains and 20 kt in the high plains. I personally look for that 40kt of shear
supercell motion 4. The right (left) mover is about 8 m/s right (left) of the mean wind along the thin line. • Draw the shear vector from the surface to about 6km (in red here) • Plot the mean 0-6km wind if it isn’t there already (green dot) • Plot a line perpendicular to the shear vector that passes through mean wind (thin line) sfc L R 6 km
Horizontal cross sections of supercell motion Make sure you are aware of ordinary and supercell motion before leaving.
V cl V = -V prop LLJ V MBE Multicell Motion If a multicell backbuilds, heavy rain is a potential threat Use original MBE Vector (“Corfidi”) Technique Vcl = 0-6 km mean wind Vllj = direction of 0-1.5 km wind Vmbe = multicell motion After Corfidi et al. (1996)
Multicell Motion • Boundary interactions • Modulates/enhances development of new convection Blue = steering layer flow Green=triple pt motion Red = multicell motion (Weaver, 1979)
Supercell tornado threat • We don’t know the ingredients and this is still frontier science • But here are some parameters to look for deciding whether to chase or not. • High storm relative helicity (SRH), especially in the lowest 1km • A strong sustained updraft, preferably one that begins close to ground, strong buoyancy in low levels • Warm moist rear flank downdraft, low LCL is a good starting proxy parameter
Storm Relative Helicity • Air that is spinning around on its axis in the direction of motion (a thrown football) • It is storm relative, therefore one must anticipate storm motion prior to storms • Best visualized on a hodograph • Also can be represented as a number in units of m2/s2 and contoured • Usually measured in the lowest 3 km but now measured also in the lowest 1 km.
SRH • Recent research shows better discrimination between tornadic and nontornadic supercells with 0-1km SRH. Most sounding programs and maps use 0 – 3 km SRH. • Look at soundings for evidence of high 0 – 1 km SRH. Edwards and Thompson, 2000
Simple and perhaps better:0-1km shear • Look for 20 kts or more for most significant mesocyclonic tornadoes
SRH contd. SRH can be enhanced by supercells themselves, especially supercells utilizing high CAPE and shear. Estimated hodograph within 20 km of the storm in following page.
Warm moist RFD • This cannot be so easily anticipated and every storm can have different RFD temperatures • But high RH boundary layers with low cloud bases (LCL) seem to have some relation Rasmussen and Blanchard, 1998
Estimating LCL heights • Look at surface obs in an unstable airmass • LCL = 222 (T – Td) LCL in feet, Temps in F • LCLs should be less than 1500 m for best tornado threat • LCL height also displayed from soundings
This storm is creating its own SRH CAPE = 4800 j/kg SRH initially at zero 0-6km shear = 60kt
Strong low-level buoyancy • Recent research courtesy of Jon Davies, Bill McCaul, suggest strong low-level buoyancy is associated with most significant tornadoes. http://home.kscable.com/davies1/LLbuoyprimer/LLbuoy_background.htm
Strong low-level buoyancy • There also is a lower Level of Free Convection (LFC) with most significant tornadoes. http://members.cox.net/jdavies1/waf796/waf796.htm
Strong low-level buoyancy • There also is a lower Convective Inhibition (CIN) with most significant tornadoes. http://members.cox.net/jdavies1/waf796/waf796.htm
LFC height example • A little marginal in SE OK. Good in NC KS
Nonmesocyclonic tornadoes • Prefer strong low-level vertical vorticity and good low-level lapse rates/buoyancy
How to forecast HP, CL, LP supercells • Storm-relative anvil layer winds likely affect the storm type • LPs more common with SR anvil winds > 30 m/s • Classics: SR anvil winds 18 – 30 m/s • HPs: SR anvil winds < 18 m/s. • Storm-to-storm seeding • Several storms in close proximity seed each other increasing rain potential and HPs • Moisture • This is a distant third but very dry atmospheres may keep storms LP
Storm-relative anvil layer winds SR winds in range for classics. Isolated storm becomes long-lasting Hoisington, KS storm. Photo by Corey Mead