Download
1 / 31
360 likes | 697 Views
Infrared Spectroscopy. Dr. Milkevitch Organic Chem II Lab Spring 2010 Feb 11 & 13, 2010. Introduction. The purpose of this experiment To introduce the student to spectroscopy Discuss the specific technique of Infrared Spectroscopy

E N D
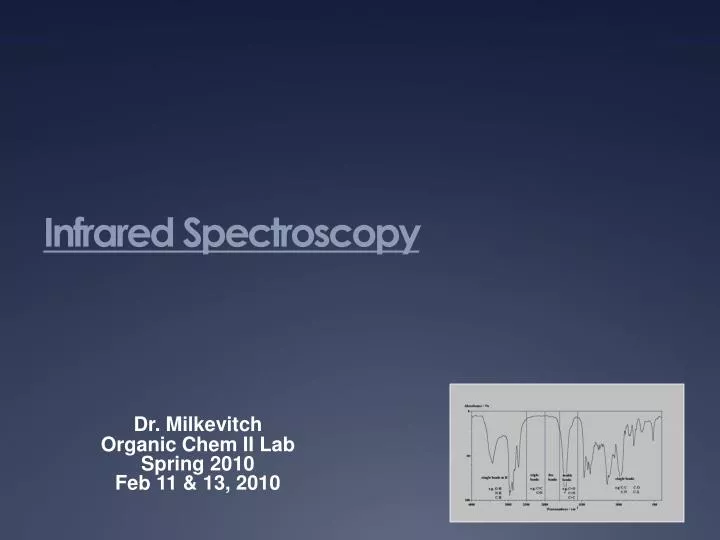
Infrared Spectroscopy Dr. Milkevitch Organic Chem II Lab Spring 2010 Feb 11 & 13, 2010
Introduction • The purpose of this experiment • To introduce the student to spectroscopy • Discuss the specific technique of Infrared Spectroscopy • Which is used to acquire structural information on organic molecules • Use this technique in the laboratory
First: In order to Understand Spectroscopy • Must understand electromagnetic radiation (EMR) • EMR is a form of energy • Has a particle and wave nature • Examples: Light, microwaves, radiowaves
We Use Symbols to Designate Properties of Waves • λ is the wavelength of the waves • ν is the frequency of the waves • c is the speed of light • of all EMR actually
Relationships Between These Variables • Speed = wavelength x frequency • Therefore: • c = λν • λ = c/ν • ν = c/λ • For electromagnetic waves, the speed (c) is constant • 3 x 10⁸ m/s
What This Means • Wavelength has a direct, inverse relationship with frequency: • λ ∝ 1/ν • The higher the frequency, the shorter the wavelength • The longer the wavelength, the smaller the frequency
Wavenumbers • When the wavelength is measured in centimeters: • the reciprocal of the wavelength (1/cm) Is directly proportional to the frequency • 1/cm Is called the wavenumber and is a commonly used term in spectroscopy
Spectroscopy Is the Study of theInteraction of Matter andElectromagnetic Radiation • In Organic Chemistry, the common techniques include: • Infrared Spectroscopy • Nuclear Magnetic Resonance Spectroscopy • UV/Visible Spectroscopy
What Spectroscopy Tells Us • Specific information on the structural features of the molecules being studied • The presence or absence of specific patterns of chemical bonding in a molecule • Infrared Spectroscopy: The use of infrared radiation to determine the presence or absence of specific patterns of bonding in a molecule (i.e., functional groups)
When IR Radiation is Applied to a Molecule • Some passes through it, but some does not • Some of it is absorbed • All bonds in a molecule have a vibrational frequency • If the frequency of the IR energy matches the specific vibrational frequency of a bond in a molecule • The molecule will absorb the IR radiation at that frequency • The bond is excited from a lower to a higher vibrational state • Amplitude of vibration increases dramatically • We can measure this absorbance of IR radiation • We can come up with a graph of absorbance intensity vs. Wavelength
E = hv = hc λ What an IR Spectrum Looks Like • Graph of absorption intensity vs. radiation frequency • Given as % transmittance • Units are in wavenumbers (cm-1), (sometimes microns)
Now, Organic Molecules are Quite Diverse • Millions of organic compounds exist • Remember the 12 families of organic compounds? • Structurally different molecules can have different functional groups • Do not absorb exactly the same frequencies of IR radiation • Therefore, give different patterns of absorption • Specific bonds and functional groups in a molecule • Have specific vibrational frequencies • Therefore, will absorb characteristic frequency ranges of IR radiation • This means: • IR spectroscopy is a valuable tool for identifying different functional groups • Also, a valuable tool for helping identify the structure of an organic compound
Ways Molecules Vibrate: Vibrational Modes • Vibrational Modes: • Fancy way to describe the ways a molecule can vibrate • 2 most important vibrational modes in IR spectroscopy: • Stretching: involves a change in interatomic distance • Bending: involves a change in bond angles Change in interatomic distance Change in bond angles
IR-Active and Inactive Bonds • Stretching and bending must: • Change the molecule’s dipole moment in order to be IR active • Large changes in dipole moment: very intense IR absorption • This is really important • Polar bonds will absorb strongly • Does a polar bond have a dipole moment? • A nonpolar bond will absorb weakly or not at all • Does a nonpolar bond have a dipole moment?
Some Trends in Vibrational Frequency • The smaller the atoms in a bond, frequency increases • Larger the atoms in a bond, frequency decreases • Bond strength also effects frequency of absorption • Stronger bonds, higher frequency of absorption Alkyne 2250 – 2100 cm-1 Alkene 1680 – 1600 cm-1 Alkane 1200 – 800 cm-1
Trends: Carbon-Hydrogen Stretching • Bonds with more s character absorb at a higher frequency • More s character, shorter and stronger bond • sp3 C-H, just below 3000 cm-1 (to the right) • sp2 C-H, just above 3000 cm-1 (to the left) • sp C-H, at 3300 cm-1
The Three Most Important Regions of the IR Spectrum • 3600 – 3100 cm-1 • Where OH and NH stretching occur • Region around 1700 cm-1 • Where C=O stretching occurs • Region around 1650cm-1 • Where C=C stretching occurs • Many of the important functional classes are identified by the presence (or absence) of absorptions in these regions
FT-IR Spectrometer • “The modern IR spectrometer” • Small and compact • Computer controlled • Has better sensitivity than dispersive instruments • Irradiate the sample with all IR frequencies at the same time • Does multiple scans quickly • Averages the results
Correlation • Table: • Summary of • Notable IR • absorbances for • the functional • Groups • Very important • For the organic • Chemist
Procedure • Each group should choose one of the following compounds: • Chlorooctane • Dodecane • Chlorodecane • Cyclohexane • Cyclohexene • 3,3-dimethyl-1-butene • Heptane • Hexane • 1-heptyne • 1-hexene
Procedure (2) • Obtain an IR spectrum • See Dr. M in the instrument lab • Interpret major absorption frequencies • Using tables in this handout • Annotate the spectrum with your interpretations
Your Report • Your introduction should include a discussion of IR spectroscopy • Your textbook also has a chapter on IR Spectroscopy, use it if necessary • No reaction mechanism or balanced equation in this experiment • Physical properties section should be the relevant physical properties of your chosen compound
Your results section should include the spectrum of your chosen compound • Annotated • What do the peaks correspond to? • If it’s not annotated, it is meaningless • Make a table of relevant absorbances, along with their identity • Conclusions: Things to think about • Did you successfully obtain your IR spectrum? • Is the spectrum clean? Crappy? Easy to obtain? • What does your IR spectrum look like? • What major peaks do you have? • What stretches do these peaks correspond to?
Do the peaks correspond to what type of compound you have (alkane, alkene or alkyne)? • Prove this: correlate your peaks to what peaks these compounds should have in an IR spectrum • Prove it further: find an IR spectrum of the compound and compare it to your spectrum • Overall, what did you learn about IR spectroscopy? • Additional Questions to answer: • Which absorbs at a higher frequency: a C-H bond or a C-D bond? Explain. • Why does H2 not have an IR spectrum? • Explain why the C=C stretch for a trans-disubstituted alkene is weaker than for a cis-disubstituted alkene.