Download
1 / 49
490 likes | 679 Views
The sea-breeze circulation. Part I: Development w/o Earth rotation. Mesoscale features in Florida animation. Horizontal convective rolls over land Sea-breeze front penetrations on all coasts Thunderstorm outflows “ Lake shadow ” downwind of Lake Okeechobee Interactions among features.

E N D
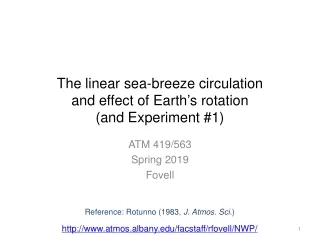
The sea-breeze circulation Part I: Development w/o Earth rotation
Mesoscale features in Florida animation • Horizontal convective rolls over land • Sea-breeze front penetrations on all coasts • Thunderstorm outflows • “Lake shadow” downwind of Lake Okeechobee • Interactions among features
Top left: Cross-shore flow w/ no mean flow. Bottom left: buoyancy for same case. Right: displacements over several hours.
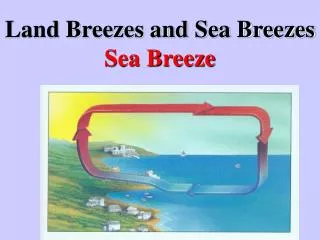
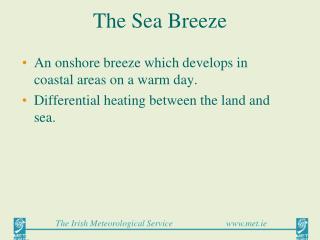
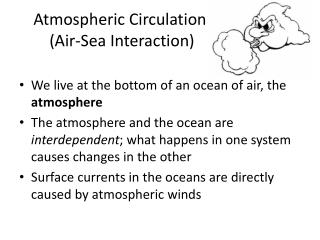
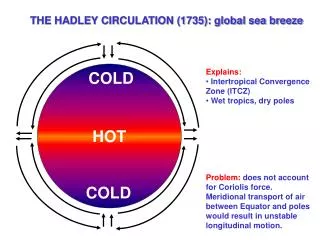
How is a sea breeze formed?First, look at a generic circulation forced by temperature differences
Pressure Same mass of water would only be 18.5 feet deep
Pressure differences make winds Sea-breeze is not this deep…
Ahrens’ text Textbook description: circulation starts from top down
dtdm < input_sbf_norolls.txt &experiment casename = 'sbf.noroll.nowind.nonanel', $ &grid_run timend = 9000., plot = 300., $ &surface_flux ishflux = 1, tdelt = 12., icoast = 90, cdh = 7.2e-3, irand = 0, $
DTDM simulation t=0 h t=2.5 h Vertical profile of over land
Making that plot ga-> set lev 0 4 ga-> set vrange 298 314 ga-> set t 1 ga-> set x 210 ga-> d th ga-> draw xlab potential temperature ga-> draw ylab height (km) ga-> set t 7 ga-> d th ga-> set t 13 [etc…]
Perturbation potential temperature (colored); cross-shore horizontal velocity (contour) coastline scripts/sbf_devel.gs scripts/sbf_devel_movie.gs
The horizontal wind isn’t blowing from land to sea first…
Onshore flow always stronger; Vertical scale grows with mixed layer
Perturbation pressure (colored); cross-shore horizontal velocity (contour) scripts/sbf_devel2.gs scripts/sbf_devel_movie2.gs
Pressure perturbation 5 km inland H t=50 min L t=5 min L at surface; local H above, decreasing farther aloft
Analysis where At the rigid surface dw/dt = 0, therefore B > 0 for the heated surface, therefore perturbation pressure increases with height
Analysis, continued Why low perturbation pressure at surface? -- Far above heated surface, atmosphere undisturbed, thus ’ ~ 0 there -- If ’ increases with height and approaches zero, surface ’ must be negative
Analysis, continued Why low perturbation pressure at surface? Another (essentially similar) view… -- Hydrostatic eqn before & after pert analysis -- Note this implies dw/dt = 0 everywhere -- ’ = 0 at model top, all (initial) ’ > 0, so vertical gradient > 0 thus L at surface needed -- neither explanation tells us why local H pressure above the heated layer…
Why does’ overshoot 0, creating perturbation H pressure at z ~ 1 km? • Solve an example 1D version of anelastic ’ equation [demonstrated soon] • Invoke mass continuity in anelastic limit H L
Anelastic continuity equation Traditional form Integrate over a 2D column -- depth from z=0 to z=Z. But… …since rigid top and surface, w(z=0) = w(z=Z) = 0, so this term vanishes
Anelastic constraint Left with… Indefinite integration yields… If onshore winds are produced in a column, compensating offshore winds must also exist This requires an offshore directed PGF to exist aloft since onshore flow generated near surface
Result of anelastic constraint Recall mean density decreases w/ height