Download
1 / 8
80 likes | 94 Views
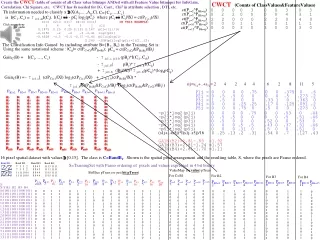
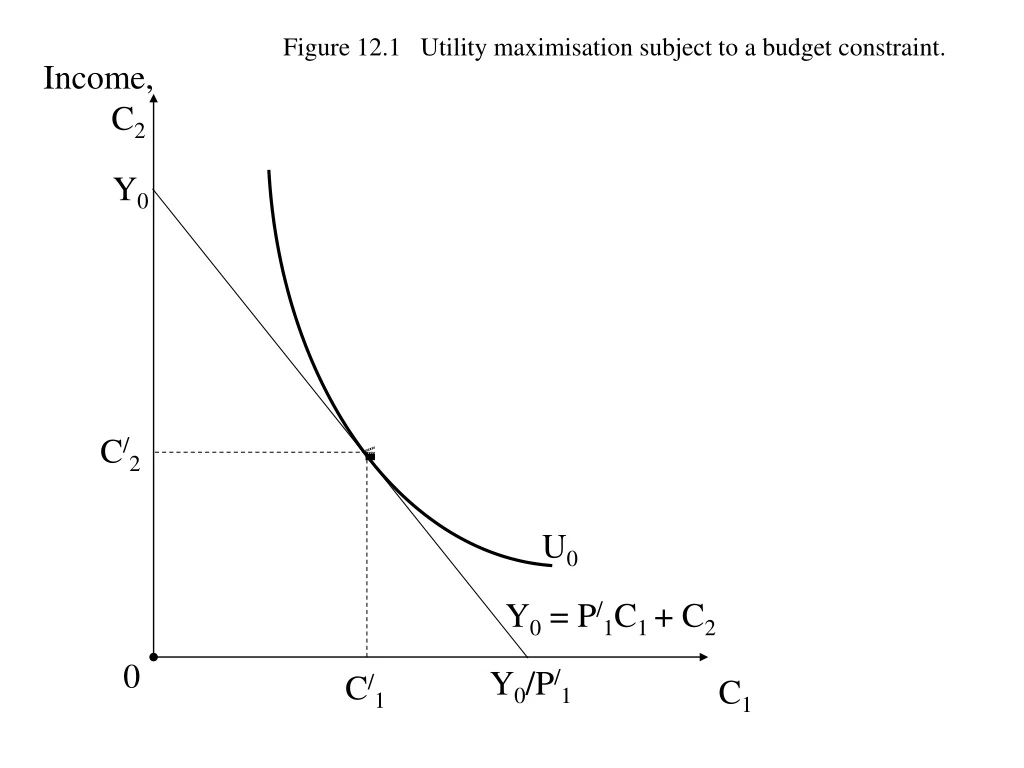
Explore utility maximization, price effects, compensating and equivalent variation, surplus, and environmental demand functions. Study linear trip-generating and illustrative demand functions.

E N D
Figure 12.1 Utility maximisation subject to a budget constraint. Income, C2 Y0 C/2 U0 Y0 = P/1C1 + C2 0 Y0/P/1 C/1 C1
Figure 12.2 The income and substitution effects of a price reduction. Income, C2 U0 U1 Y0 C//2 b a C/2 d 0 C1 C/1 C*1 C//1 Y0/P//1 Y0/P/1
Figure 12.4 Compensating variation and equivalent variation. H(U0) H(U1) P/1 a f b P//1 d Y 0 C///1 C////1 C/1 C//1
Figure 12.5(a) Compensating surplus . C2 U1 U0 Y0 YN b a f E e E/ 0 E// d
C2 Figure 12.5(b) Equivalent surplus . YN U1 U0 Y0 h a b g f E/ d 0 E// E
Figure 12.6 Environmental quality as a commodity demand function parameter P1 PC1(En) PC1(Eo) A b a PF1 H(P1, …, PN, En , U0) H(P1, …, PN, Eo , U0) 0 C/1 C1 C//1
Figure 12.7 The linear trip-generating function E[Vi] E[Vi*] 0 Pi* P


![ ~ 0 [u(x,y)/U e ] (1 – u(x,y)/U e )dy](https://cdn3.slideserve.com/6012858/slide1-dt.jpg)