Download

1 / 16
160 likes | 258 Views
Modeling and Input Optimization Under Uncertainty for a Collection of RF MEMS Devices. Matt Allen 1 , Rich Field 2 & Jordan Massad 2 1 University of Wisconsin-Madison Madison, WI 2 Sandia National Laboratories* Albuquerque, NM

E N D
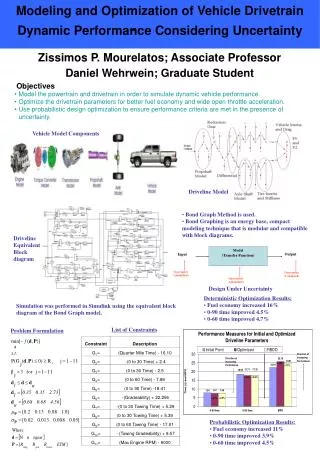
Modeling and Input Optimization Under Uncertainty for a Collection of RF MEMS Devices Matt Allen1, Rich Field2 & Jordan Massad2 1University of Wisconsin-Madison Madison, WI 2Sandia National Laboratories* Albuquerque, NM 2006 ASME International Mechanical Engineering Congress and Exposition Chicago, IL November 2006 Sandia is a multi-program laboratory operated by Sandia Corporation, a Lockheed Martin Company, for the United States Department of Energy’s National Nuclear Security Administration under Contract DE-AC04-94AL85000.
Introduction • There has been significant interest in RF MEMS switches because they can potentially provide: • very low power consumption • high isolation • excellent linearity • contained in a compact package • One significant challenge is obtaining the high reliability required. • Previous studies at Sandia have observed orders of magnitude increase in life when the impact velocity of the switches is reduced. • This is difficult because the electro-static closing force is highly nonlinear.
Outline • Switch design and uncertainty model • Response of ensemble of switches to: • Unshaped waveform • Deterministically designed waveform • Optimization Under Uncertainty (OUU) • Improving performance: • Effect of a design change and OUU • Effect of process improvement and OUU • Conclusions • Wild cheering and applause
Switch Design • RF Switch consists of a stiff plate suspended by four folded leaf springs. • A voltage is applied to a pad under the plate resulting in an electrostatic force that closes the switch. • The switch is well approximated by a single-degree of freedom model. • The input is shaped to limit excitation to higher modes to assure that this assumption is valid.
OUU Approach • Random variation in switch parameters described by probability density functions (PDFs). • Waveform optimized numerically to minimize impact velocity over the ensemble of switches. ? ? ? ? Deterministic Approach • Variation in switch parameters is ignored. • Waveform designed semi-analytically to satisfy the switch with average parameters. • Succeeds only if the optimum is insensitive to variation in switch parameters.
Uncertainty Model • Plate thickness, electrostatic gap, travel distance and elastic modulus were measured and fit to uniform and Beta Probability Density Functions (PDFs). • Expert opinion was used to augment the data since few samples were available. • Modulus and Thickness were used to deduce effective mass and stiffness. PDF PDF
Response without Input Shaping • 90% of the switches experience maximum contact velocities below 40.3 cm/s 90 % Upper Quantile
Vu = 43 cm/s Deterministic Waveform Design • A waveform that is optimum in a deterministic sense gives higher contact velocities than an unshaped waveform when applied to the ensemble of switches.
Optimization Objective & Strategy • Optimization Objective: • g(ts1,…) = vu+ cnc*pnc • 90% of the switches experience contact velocities lower than vu • (i.e. P(Vmax > vu) = 0.10) • pnc is the probability that a switch doesn’t close in 250 s • cnc is a constant to weight the relative importance of the two • Optimization Strategy: • Set u2 = 0 and adjust tp(1) (duration of first pulse) until the maximum contact velocity for the ensemble of 200 switches is ~10cm/s. • Use exhaustive search to find starting values for ts(2) (start time of second pulse), tr(2) (rise time of second pulse) and u2 (maximum voltage of second pulse). • Refine using Nelder-Mead Simplex algorithm.
Vu = 20 cm/s OUU Waveform Design • Results: • 90% have maximum contact velocities below 20 cm/s • The mean maximum contact velocity is 15.3 cm/s • These represent improvements of more than 50% compared to the unshaped waveform or the deterministically designed waveform. • None of the switches have a contact velocity near zero.
Design Change • Electrostatic force varies with the inverse square of the electrostatic gap (G) minus the switch displacement (X). • The displacement (X) is less than the travel distance (D). • The system is unstable for: • X > G/3 => D/G > 1/3 • Currently: • 0.59 · D/G · 0.75 • The design was modified to reduce this ratio resulting in • 0.41 · D/G · 0.52. • This design does not venture as far into the unstable region as the previous did.
Vu = 13 cm/s Design Change and OUU • 35 % reduction in upper and mean contact velocities. • Upper reduced from 19.7 to 12.5 cm/s • Mean reduced from 15.3 to 9.8 cm/s • Contact velocity is 70% less than unshaped waveform or deterministically designed waveform.
Process Improvement • How much would the performance improve if the process repeatability were improved by 50%? • Coefficient of Variation of the following were decreased by 50%. (COV = standard deviation / mean). • Gap Distance • Travel Distance • Thickness • Optimization procedure was repeated with this modified uncertainty model for the switch. • This level of improvement may not be feasible, but this type of analysis can provide motivation for allocating resources to process improvement.
Vu = 13 cm/s Process Improvement and OUU • Simulated the effect of process improvement: • Reduced the COV of gap, travel and thickness by 50% • >35% reduction in upper and mean contact velocities • Upper 12.8 cm/s vs 19.7 cm/s • Mean 9.6 cm/s vs. 15.3 cm/s
Conclusions • Shaped waveforms can reduce the impact velocity that an ensemble of switches experiences. • The contact velocity was reduced by 50% using the waveform that was optimized under uncertainty. • Further reductions of 35% were demonstrated after modifying the switch design or reducing process variability. (Net reduction of 70%) ? • Uncertainty must be accounted for when designing shaped waveforms. • A waveform that was optimum for the average switch actually increased the impact velocity when applied to the ensemble of switches.