Download
1 / 19
220 likes | 470 Views
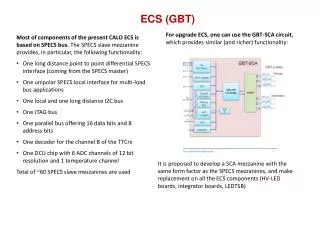
ECS. ECS. Overview Features Architecture Benefits Reports. Overview. The only near real time VOD monitoring and reporting solution Custom designed for a MSO Deployed across all TWC sites, key VOD sites for Cox, Bright House Networks and N American MSO

E N D
ECS • Overview • Features • Architecture • Benefits • Reports
Overview • The only near real time VOD monitoring and reporting solution • Custom designed for a MSO • Deployed across all TWC sites, key VOD sites for Cox, Bright House Networks and N American MSO • Compelling usage metrics for operational analysis
ECS Features • Timely information at a glance • In-depth data, collected system wide • Seamless integration • Platform agnostic
ECS Features • Powerful Alerts • Extensive reporting capability • Easy and intuitive web GUI • Open database architecture
ECS Features • No impact to system performance • Transfers data only when the monitored components are not using the CPU • Easily configurable to accommodate new/ upgraded components • Support Program addresses different levels of operational and technical needs
ECS Data includes • Session timing data • Start time, Setup time, Duration • Viewer information - STB, Service Group, Hub • Resource usage - QAM, Bandwidth, MPEG Program, Transport Stream ID, Stream ID • Asset data - Asset ID, • Network information - Heartbeat, Teardown component, Teardown reason
ECS Benefits Increases Operational Efficiencies
Operational Efficiencies • VOD system health at a glance • Reduces operational support load • Quickly and proactively identifies service outage • Troubleshoots and pinpoints VOD session issues • Automaticnotification as problems arise • Ability to drill down into various levels of data from Hub, Service Group, QAM to STB level • Helps to immediately isolate problem areas
Operational Efficiencies • Identify problem components • Specific STB, QAM, Video Server or other components • Identify VOD session bottlenecks • Quick problem resolution • Identify bandwidth choke points
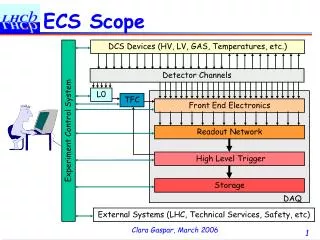
ECS Strengths • Near real time • Sniff data from the complete VOD network • Maintain the state data • Hub level and QAM level Grouping • Drill down data to the STB level • Vendor agnostic
Reports • Robust reporting capability • Number of predefined reports • Open database architecture allows for customize reports using off-the-shelf tools • Reporting interface provides extensive filtering criteria • Graphical presentation with color coded results helps to identify the problem areas • Provides detailed reports based on hubs, service groups, QAMs or STBs
6470 East John’s Crossing Suite 370 Duluth, GA 30097 T 770. 368 4024 F 770. 246 0616 E info@itaas.comW www.itaas.com