Download

1 / 32
330 likes | 572 Views
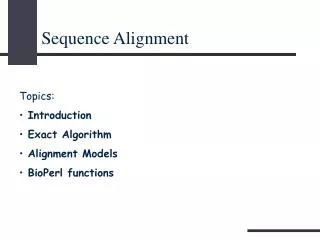
Next-gen Sequence Alignment and Applications. Zemin Ning The Wellcome Trust Sanger Institute. Outline of the Talk:. Global and Local Alignment Statistical significance of alignment Alignment method SSAHA2 Algorithm Alignment Visualization - Gap5. Biological Motivation

E N D
Next-gen Sequence Alignment and Applications Zemin Ning The Wellcome Trust Sanger Institute
Outline of the Talk: • Global and Local Alignment • Statistical significance of alignment • Alignment method • SSAHA2 Algorithm • Alignment Visualization - Gap5
Biological Motivation Why We Need Sequence Alignment • Inference of Homology • Two genes are homologous if they share a common evolutionary history. • Evolutionary history can tell us a lot about properties of a given gene • Homology can be inferred from similarity between the genes • Variation Detection – SNP, indel, CNV
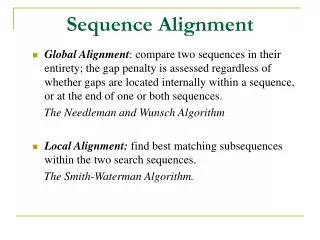
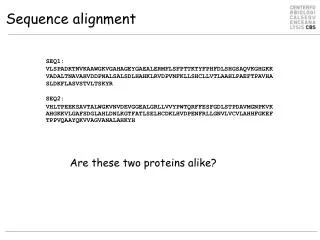
Sequence Alignment Global Alignment: Goal: How similar are two sequences S1 and S2 Input: two sequences S1, S2 over the same alphabet Output: two sequences S’1, S’2 of equal length (S’1, S’2 are S1, S2 with possibly additional gaps) Example: • S1= GCGCATGGATTGAGCGA • S2= TGCGCCATTGATGACC • A possible alignment: S’1=-GCGC-ATGGATTGAGCGA S’2= TGCGCCATTGAT-GACC--
Sequence Alignment (cont) Local Alignment: Goal: Find the pair of substrings in two input sequences which have the highest similarity Input: two sequences S1, S2 over the same alphabet Output: two sequences S’1, S’2 of equal length (S’1, S’2 are substrings of S1, S2 with possibly additional gaps) Example: • S1=GCGCATGGATTGAGCGA • S2=TGCGCCATTGATGACC • A possible alignment: S’1=ATTGA-G S’2= ATTGATG
Global vs. Local Alignment • The Global Alignment Problem tries to find the longest path between vertices (0,0) and (n,m) in the edit graph. • The Local Alignment Problem tries to find the longest path among paths between arbitrary vertices (i,j) and (i’, j’) in the edit graph.
Global vs. Local Alignment (cont’d) • Global Alignment • Local Alignment—betten alignment to find conserved segment --T—-CC-C-AGT—-TATGT-CAGGGGACACG—A-GCATGCAGA-GAC | || | || | | | ||| || | | | | |||| | AATTGCCGCC-GTCGT-T-TTCAG----CA-GTTATG—T-CAGAT--C tccCAGTTATGTCAGgggacacgagcatgcagagac |||||||||||| aattgccgccgtcgttttcagCAGTTATGTCAGatc
Compute a “mini” Global Alignment to get Local Local Alignment: Example Sequence2 Local alignment Global alignment Sequence1
StatisticSignificance of Alignment We need to know how to evaluate the significance of the alignment. There are two scenarios: First, the alignment indicates an evolutionary relationship between the sequences. Second, the alignment is a chance occurrence. What answer is correct? Here, the statistics are important to estimate of probability that the given alignment score might occur by chance.
E Value (E) • E value (E) of an alignment score is the expected number of unrelated sequences in a database that would have a score at least as good. • Low E-values suggest that sequences are homologous. • IfE value ≤ 0.02 sequence probably homologous • IfE value≤ 1 homology cannot be ruled out • IfE value> 1 a match just by chance • Statistical significance depends on both the size of the alignments and the size of the sequence database • Important consideration for comparing results across different searches • E-value increases as database gets bigger • E-value decreases as alignments get longer E value Measuring Alignment Significance
Methods of DNA Sequence Alignment • Dot matrix analysis • The dynamic programming (DP) algorithm • Needleman-Wunsch Algorithm • Smith-Waterman Algorithm • Suffix tree (BWA, Bowtie, SOAP2 etc) • Hash table based algorithm (SSAHA2, Blat, SOAP, Mosaik) • Short read alignment tools (Eland, MAQ, RMAP)
Dot Matrix Analysis • A dot matrix analysis is a method for comparing two sequences to look for possible alignment (Gibbs and McIntyre 1970) • One sequence (A) is listed across the top of the matrix and the other (B) is listed down the left side • Starting from the first character in B, one moves across the page keeping in the first row and placing a dot in many column where the character in A is the same • The process is continued until all possible comparisons between A and B are made • Any region of similarity is revealed by a diagonal row of dots • Isolated dots not on diagonal represent random matches
The Needleman-Wunsch Algorithm x = AGTA m = 1 y = ATA s = -1 d = -1 F(i,j) i = 0 1 2 3 4 Optimal Alignment: F(4,3) = 2 AGTA A - TA j = 0 1 2 3
Smith-Waterman Algorithm • Only works effectively when gap penalties are used • In example shown • match = +1 • mismatch = -1/3 • gap = -1+1/3k (k=extent of gap) • Start with all cell values = 0 • Looks in subcolumn and subrow shown and in direct diagonal for a score that is the highest when you take alignment score or gap penalty into account Hij=max{Hi-1, j-1 +s(ai,bj), max{Hi-k,j -Wk}, max{Hi, j-l -Wl}, 0}
Suffix Tree Example Mapping the string ababc into a suffix tree. root ab c b abc c abc c
ATGGCGTGCAGTCCATGTTCGGATCA ATGGCGTGCAGT TGGCGTGCAGTC GGCGTGCAGTCC GCGTGCAGTCCA CGTGCAGTCCAT Non-overlap hashing W = N-k+1 (k = 12) ATGGCGTGCAGTCCATGTTCGGATCATTACGTAAGC ATGGGCAGATGT CCATGTTCGGAT CATTACGTAAGC Overlap Hashing W = N/k Non-overlap Hashing v Overlap Hashing
Sequence S: (s1s2, …, si, …, sm) i =1,2, …, m K-tuple: (sisi+1...si+k-1) “A” =00; “C” = 01; “G” = 10; “T” = 11 Sequence Representation Using two binary digits for each base, we may have the following representations: For any of the m/k no-overlapping k-tuples in the sequence, an integer may be used to represent the k-tuple in a unique way where bi = 0 or 1, depending on the value of the sequence base and Emax is the maximum value of the possible E values.
Sequence hashing - the SSAHA way -kmer k 000000011101000100100011 -skip s AAAGTGAGACAT GAGAAAGTGAGA TAAGAGAAAGTG 'subject' sequence TAAGAGAAAGTGAGACAT 1 N hash table body [(N-k)/s]+1 entries head 22k+1 entries 0 i+1 hash key i = 000000011101000100100011 ‘query' sequence AGAGAAAGTGAGACATGGCAT AGAGAAAGTGAG GAGAAAGTGAGA AGAAAGTGAGAC GAAAGTGAGACA AAAGTGAGACAT
E k-tuple Ni Indices and Offsets 0 AA 1 2, 19 1 AC 3 1, 9 2, 5 2, 11 2 AG 2 1, 15 2, 35 3 AT 2 2, 13 3, 3 4 CA 7 2, 3 2, 9 2, 21 2, 27 2, 33 3, 21 3, 23 5 CC 4 1, 21 2, 31 3, 5 3, 7 6 CG 1 1, 5 7 CT 6 1, 23 2, 39 2, 43 3, 13 3, 15 3, 17 8 GA 4 1, 3 1, 17 2, 15 2, 25 9 GC 0 10 GG 5 1, 25 1, 31 2, 17 2, 29 3, 1 11 GT 6 1, 1 1, 27 1, 29 2, 1 2, 37 3, 19 12 TA 1 3, 25 13 TC 6 1, 7 1, 11 1, 19 2, 23 2, 41 3, 11 14 TG 3 1, 13 2, 7 3, 9 15 TT Hash Table: A 2-tuple hashing table of S1, S2 and S3 S1=(GTGACGTCACTCTGAGGATCCCCTGGGTGTGG) S2=(GTCAACTGCAACATGAGGAACATCGACAGGCCCAAGGTCTTCCT) S3=(GGATCCCCTGTCCTCTCTGTCACATA)
SSAHA seeds Edge length Edge length Sequence for cross_match SSAHA2 = SSAHA + Cross_Match SSAHA for matching seeds, cross_match for sequence alignment.
Read Reference 27 14 25 30 21 29 Mapping Score in ssaha2 • Read mapping score is used to assess the repetitive feature of the read in the genome. With a maximum mapping score 50, we have: • R = read length; Smax - maximum alignment score (smith-waterman) of the hits on genome; Smax2 - second best alignment score of the hits on genome; Say you have one read of 30 bases which has a few hits on the genome: Best hit: exact match with Smax 30; Second best hit: one base mismatch with Smax2 29. The mapping score for this read is Smap = 10;
Reference samtools Illumina/454 Reads SSAHA2 Gap5 SNPs/Indeks SSAHA2 Workflow SAM/BAM File
maq ssaha2
maq ssaha2
maq ssaha2
maq ssaha2
Acknowledgements: • Jim Mullikin • Yong Gu • Hannes Ponstingl • James Bonfield • Heng Li • Tony Cox • Richard Durbin