Download
1 / 44
440 likes | 587 Views
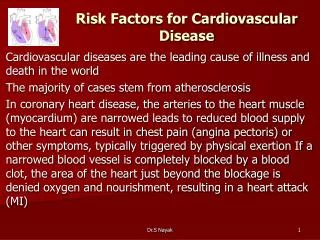
Monitoring cardiovascular risk factors in the US population. Cynthia Ogden, PhD, MRP & Cheryl Fryar, MSPH. National Center for Health Statistics. Division of Health and Nutrition Examination Surveys. U.S. population-based estimates of: Health conditions

E N D
Monitoring cardiovascular risk factors in the US population Cynthia Ogden, PhD, MRP & Cheryl Fryar, MSPH National Center for Health Statistics Division of Health and Nutrition Examination Surveys
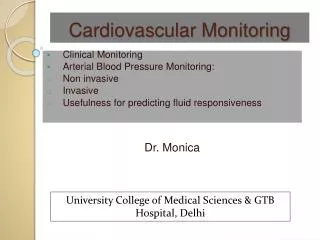
U.S. population-based estimates of: Health conditions Awareness, treatment and control of selected diseases Environmental exposures Nutritional status and diet behaviors Goals of National Health and Nutrition Examination Surveys (NHANES)
National Health and Nutrition Examination Surveys Survey Dates Ages NHES I1960-62 18-79 years NHES II1963-65 6-11 years NHES III1966-70 12-17 years NHANES I1971-75 1-74 years NHANES II1976-80 6 mo.-74 years HHANES1982-84 6 mo.-74 years NHANES III1988-94 2 mo. +
National Health and Nutrition Examination Surveys Dates Survey Ages NHANES1999-2000 All ages NHANES2001-2002 All ages NHANES2003-2004 All ages NHANES2005-2006 All ages NHANES2007-2008 All ages NHANES2009-2010 All ages NHANES2011-2012 All ages OP96S025
US Civilian, non-institutionalized population All ages Oversample: African Americans Asian Americans Hispanics/Latinos Older persons aged 60+ Low income whites Sample
Stage 1 Counties Stage 2 Segments Stage 3 Households Stage 4 SPs
Broad range of health conditions Health-related behaviors and exposures Health care utilization Health insurance Prescription medications Dietary supplements Interview
Complete blood count Pregnancy test Specimen processing Blood, urine, water, swabs, wipes 300 assays 24 laboratories Mobile exam center laboratory
Nutritional biomarkers Hormone tests Diabetes Lipids, CRP Biochemistry profile Infectious diseases Environmental exposures Laboratory tests
Percent of adults with high serum total cholesterol, US, 2009-2010 Percent • Greater than or equal to 240 mg/dL; 1 Significantly different from non-Hispanic white; 2 Significantly different from non-Hispanic black; 3 Significantly different from men in the same race/ethnicity group. SOURCE: CDC/NCHS, National Health and Nutrition Examination Survey. Carroll et al NCHS Data Brief 2012
Trends in the percent of adults with high serum total cholesterol, US, 1999-2010 40-59 years 60 years and older Percent Percent * * * † A serum total cholesterol greater than or equal to 240 mg/dL *Significant decreasing trends (p<0.005) NOTES: HP 2010 = Healthy People 2010 Objective (17%). SOURCE:CDC/NCHS, National Health and Nutrition Examination Survey,.
Percent of adults with low HDL, US, 2009-2010 Percent • †Less than 40 mg/dL1 Significantly different from non-Hispanic white 2 Significantly different from non-Hispanic black 3 Significantly different from men in the same race/ethnicity groupSOURCE: CDC/NCHS, National Health and Nutrition Examination Survey
Analysis Linking Health Insurance Questionnaire and Exam Data
Status of the ABCS Source: MMWR: Million Hearts: Strategies to Reduce the Prevalence of Leading Cardiovascular Disease Risk Factors --- United States, 2011, Early Release, Vol. 60
Uncontrolled High Blood Pressure Measured systolic blood pressure ≥140 mm Hg or a diastolic blood pressure ≥90 mm Hg, based on the average of up to three measurements Persons may or may not have been taking medication
Uncontrolled High LDL-Cholesterol Measured levels of LDL cholesterol above the treatment goals established by the National Cholesterol Education Program (NCEP) Adult Treatment Panel-III (ATP-III) guidelines: <160 mg/dL, <130 mg/dL, and <100 mg/dL for low-, intermediate-, and high-risk groups, respectively. Persons may or may not have been taking medication.
Smoker Person reporting that they smoked at least 100 cigarettes in their lifetime and now smoke every day or some days, or a measured serum cotinine (the primary nicotine metabolite) level >10 ng/mL.
Prevalence and number of US adults who smoke or have uncontrolled high BP or uncontrolled high cholesterol Linear trend in prevalence significant (p<0.01) after adjustment for sex, age group, race/ethnicity, and poverty-income ratio. MMWR Sept 2011. Updated with 2009-10 data.
Percentage of US adults with at least 1 risk factor Percent Source: CDC/NCHS, National Health and Nutrition Examination Survey 2009-2010
Percentage of men with at least 1 risk factor, by age: US, 1999-2010 Percent Source: National Health and Nutrition Examination Surveys; Fryar et al 2012 NCHS Data Brief
Percentage of women with at least 1 risk factor, by age: US, 1999-2010 Percent Source: National Health and Nutrition Examination Surveys; Fryar et al 2012 NCHS Data Brief
Percentage of adults with at least 1 risk factor, by sex and age: US, 1999-2010 Women Source: National Health and Nutrition Examination Surveys; Fryar et al 2012 NCHS Data Brief
Sex specific results • 1999-2010 decrease • Men 40-59 and 60+ years • Women 60+ years • Men more likely • Older women more likely than younger
Percentage of adults with at least 1 risk factor, by race/ethnicity: US, 1999-2010 Percent Source: National Health and Nutrition Examination Surveys; Fryar et al 2012 NCHS Data Brief
Race/ethnicity specific results 2 1 1 • 1999-2010 decrease • Non-Hispanic white adults • Mexican American adults • Non-Hispanic black adults more likely
Percentage of adults with at least 1 risk factor, by poverty level: US, 1999-2010 Percent Source: National Health and Nutrition Examination Surveys; Fryar et al 2012 NCHS Data Brief
PIR specific results 1,2 1,2 1,2 • 1999-2010 decrease • All income groups • Lowest income adults more at likely
Percentage of adults who smoke: US, 1999-2010 Percent Source: National Health and Nutrition Examination Surveys; Fryar et al 2012 NCHS Data Brief
Percentage of adults with uncontrolled high LDL cholesterol: US, 1999-2010 Percent Source: National Health and Nutrition Examination Surveys; Fryar et al 2012 NCHS Data Brief
Percentage of adults with uncontrolled high blood pressure: US, 1999-2010 Percent Source: National Health and Nutrition Examination Surveys; Fryar et al 2012 NCHS Data Brief
Percentage of adults with at least 1 risk factor: US, 1999-2010 Percent Source: National Health and Nutrition Examination Surveys; Fryar et al 2012 NCHS Data Brief
Individual risk factors 1 1 1 • 1999-2010 decrease • Uncontrolled high blood pressure • Uncontrolled high LDL cholesterol
NHANES and CVD risk factors • NHANES resource for monitoring trends • Percent of US adults with 1+ risk factor • Decrease 1999-2010 • Not among African Americans • Men, older adults, African Americans, lower income adults more likely to have risk factors • Percent of US adults with Individual risk factors • Decrease in uncontrolled high blood pressure and uncontrolled high LDL cholesterol • No significant change in smoking
Thank you to our colleagues Margaret Carroll, MSPH Te-Ching Chen, PhD Xianfen Li, MS Disclaimer The findings and conclusions in this presentation are those of the author and not necessarily of CDC