Download
1 / 16
180 likes | 308 Views
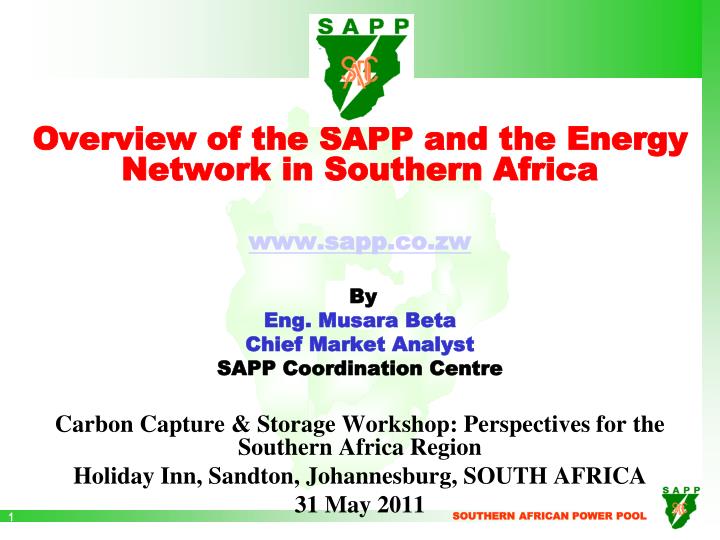
Overview of the SAPP and the Energy Network in Southern Africa www.sapp.co.zw By Eng. Musara Beta Chief Market Analyst SAPP Coordination Centre Carbon Capture & Storage Workshop: Perspectives for the Southern Africa Region Holiday Inn, Sandton, Johannesburg, SOUTH AFRICA 31 May 2011.

E N D
Overview of the SAPP and the Energy Network in Southern Africa www.sapp.co.zw By Eng. Musara Beta Chief Market Analyst SAPP Coordination Centre Carbon Capture & Storage Workshop: Perspectives for the Southern Africa Region Holiday Inn, Sandton, Johannesburg, SOUTH AFRICA 31 May 2011
INTRODUCTION TO SAPP SAPP DEMAND & SUPPLY BALANCE SAPP GENERATION MIX TRANSMISSION NETWORK DEVELOPMENT DEMAND SIDE MANAGEMENT SAPP COMPETITIVE MARKET CONCLUSION CONTENTS
1. INTRODUCTION TO THE SAPP DR Congo Tanzania Angola Malawi Zambia Zimbabwe Namibia Mozambique Botswana Swaziland South Africa Lesotho Geographic • 12 Countries • 230 Million people • Average Electricity growth rate 3% p.a. • For South Africa demand growth was 4.9% in 2007 and for whole region 4.6%.
Motivation to SAPP Formation Hydro Northern Network DRC Tanzania Malawi Angola Zambia Zimbabwe Namibia Mozambique Botswana Swaziland Thermal Southern Network South Africa Lesotho
Membership CEC and LHPC private companies admitted following SAPP reforms
SAPP Planned & Required Gen. Capacity 2014 Critical For Capacity 2016 Critical For Energy
SAPP GENERATION MIX - Current 74.3% Coal 20.1% Hydro 4.0% Nuclear 1.6% Gas/Diesel
Medium Term Outlook • Of the 28,462MW to be commissioned, approximately 80% will be coal and 12% hydro.
Planned New Generation • The SAPP PLAN shows that 56,686 MW of new additional power generation capacity would be required by 2025 as follows: • The optimized plan includes no new nuclear.
SAPP Future Generation Mix • In 2025, a total of 102,871 MW of generation would be required in the SAPP as follows:
TRANSMISSION PROJECTS DRC 2013: ZIZABONA -220/330 kV Tanzania 2013: Mozambique Malawi 2014: Zambia - Tanzania - 400 kV Malawi Angola Zambia 2015:DRC - Angola – 400 kV Zimbabwe Namibia 2016: MOZAMBIQUE BACKBONE -RSA Mozambique Botswana 2015: RSA Strengthening Swaziland 2017: Namibia – Angola Lesotho South Africa
5,000.00 HWLC Commercial Lighting 4,000.00 SWH CFLs 3,000.00 Demand Reduction [MW] 2,000.00 1,000.00 - 2009 2010 2011 2012 2013 2014 2015 Year DEMAND SIDE MANAGEMENT • Four technologies were planned: • Compact florescent lamps (CFLs) • Solar Water Heaters (SWH) • Hot Water Load Control (HWLC), and • Commercial Lighting In 2010, 750MW of savings were realised with CFL programme against a target of 1400 MW
SAPP COMPETITIVE MARKET OVERVIEW • SAPP DAM Market opened for live trading on 15 December 2009 • Market performance highlights as of 31st April 2011 • 437,000 MWh Sale and 338,000 MWh Buy bids received • 42,000 MWh was matched on the DAM trading platform • However only 29,000 MWh was traded or approximately 1% market share • The remainder could not be traded due to transmission constraints
CONCLUSION • SAPP is making efforts to reduce carbon emissions • In the long-term, high cost coal will be displaced by cleaner energy sources such as hydro, wind and solar • Coal % to be reduced from 74% to 56%. • Hydro % to be increased from 20% to 26% • Wind and solar % to be increased from 0% to approx. 0.5% • SAPP has reformed in line with world wide trends in the electricity sector • To date SAPP has introduced a competitive power market in the form of a Day Ahead Market • Intends to introduce other markets incl. Carbon markets