Download
1 / 32
320 likes | 337 Views
Dive into the testimony by Tom Stinson and Tom Gillaspy to end poverty in Minnesota by 2020, exploring income, poverty guidelines, statistics, trends, and alternative poverty measures.

E N D
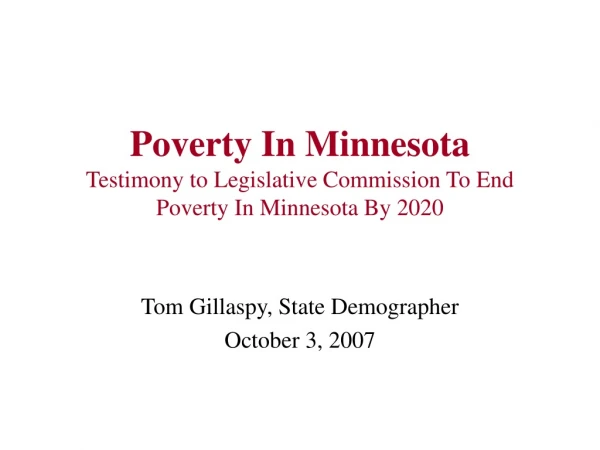
Poverty In MinnesotaTestimony to Legislative Commission To End Poverty In Minnesota By 2020 Tom Stinson, State Economist Tom Gillaspy, State Demographer August 2007
Who Are the Poor? The poor are those unable to purchase a minimum adequate market basket of goods and services
Earnings Dividends Interest Rent and royalties Trust income Pensions Social Security Unemployment Workers comp SSI Veterans benefits Public assistance Child support Alimony Poverty Status Is Determined by Money Income
What Income Is Excluded? • Non cash benefits – food stamps, housing subsidies, Medicare, Medicaid • Capital gains • Money withdrawn from savings
Other Considerations • Income is measured before taxes • Combined income of all family members • Incomes of non-relatives (roommates) are not counted • The same thresholds apply in all states • No urban-rural or regional differences • Not relative to other’s incomes
Who Is Not Counted In The Poverty Statistics? • People in institutions—nursing homes, prisons • People in group quarters but not institutionalized—college students living in dorms, group homes, shelters • The homeless
How Was the Poverty Line Developed • Poverty line was defined as 3 times the cost of USDA’s economy food plan in 1963 • Since then the poverty line has increased to match the increase in the Consumer Price Index
Mississippi 21.3% Louisiana 19.8% Dist of Columbia 19.0% New Mexico 18.5% West Virginia 18.0% New Hampshire 7.5% Maryland 8.2% Connecticut 8.3% New Jersey 8.7% MINNESOTA 9.2% Highest & Lowest Poverty Rate States 2005 ACS
Minnesota Poverty Rate Is Typically Lower Than The Nation CPS poverty rate with 90% confidence interval
Poverty Is Higher Inside The Beltway And In Greater Minnesota
Highest Poverty In Minneapolis & St. PaulGreater Minnesota Also High 2005 ACS
Part Of The Difference Between Minnesota’s Poverty Rate And The Nation Is Difference In Racial And Ethnic Structure 2005 ACS. Mn v US difference for Black /African American and American Indian are not statistically significant at 90% confidence. All other differences are significant
High Poverty For Children & Young AdultsRises Again Over Age 75 2005 ACS
Families With Children Have Higher Poverty Rates; Family Type Also Matters 2005 ACS. Families only. Does not include people living alone. All differences Between Mn and US are statistically significant at 90% confidence
Poverty Declines As Education Increases 2005 ACS. Rates for population age 25 and older. Differences significant at 90% confidence
Not All Poverty Is the Same • Business Cycle • Temporary lay-off • Life cycle • College students • Retirees • Event • Disability
Minnesota Poverty Rate Trends Higher During Economic Downturns CPS poverty rate with 90% confidence interval
Much Poverty Is EpisodicResults of Panel Study of income Dynamics 1996-1999 • A third (34%) of Americans were poor for at least 2 months during the 4 year period • 2% were poor every month of the 4 years • Half (51%) of poverty spells last 4 months or less • 80% of poverty spells last 1 year or less
Some Types of Poverty Are Long Lived • Chronic • Insufficient skill base • Weak local/regional economy • Intergenerational
An Alternative View Based On Characteristics Of The Householder • Circumstances & characteristics of householders say much about poverty of household members • Multiple poverty risk characteristics dramatically increases likelihood of poverty
Eight Characteristics Of Householders Account For Three-Fourths Of Minnesota’s Poor
Poverty Rate of People In Selected Households With Householder Experiencing Multiple Risk Factors 2005 ACS micro data. Each of the above groups comprise more than 5,000 Minnesota households
Alternative Definitions of Poverty • Multiples of the existing poverty line • Adjusting for assets • Adjusting for access to publicly provided goods and services • Basic needs studies
Numbers of Poor & Near Poor Have Changed Little Since 1990 1990 & 2000 Census & 2005 ACS
Highest Poverty Rates In Minneapolis & St. Paul—Greater Minnesota Also Higher 2005 ACS
Highest Poverty Rates Among Minnesota Young Adults But Near Poverty Is High Among Elderly 2005 ACS
And In Conclusion • Minnesota has one of the lowest poverty rates in the nation • Poverty is transient for some; more chronic for others • Our low rate is not quite as good as we might think • Sharp differences in poverty rates exist between groups and regions
A Few Alternative Measures Of Poverty • Current (2003) official US rate 12.5% • Official + capital gains minus income & payroll taxes 12.0% • #2 plus value of non cash benefits 9.7% • Official rate adj for cost of living diff & medical out of pocket expenses 13.2% • Food insecure (2005) 11.0%
Sources Of Income For Minnesotans Below Poverty In 2005 2005 ACS