Download
1 / 8
0 likes | 17 Views
Discover the key metrics crucial for evaluating the success of your User Interface (UI) and User Experience (UX) design efforts with our comprehensive guide. From engagement rates to conversion funnels, delve into the analytics that reveal how users interact with your digital platforms. Elevate your understanding of UI/UX performance and optimize your strategies for enhanced user satisfaction and business growth. <br><br>Download now to master the metrics that matter in the digital landscape.<br>

E N D
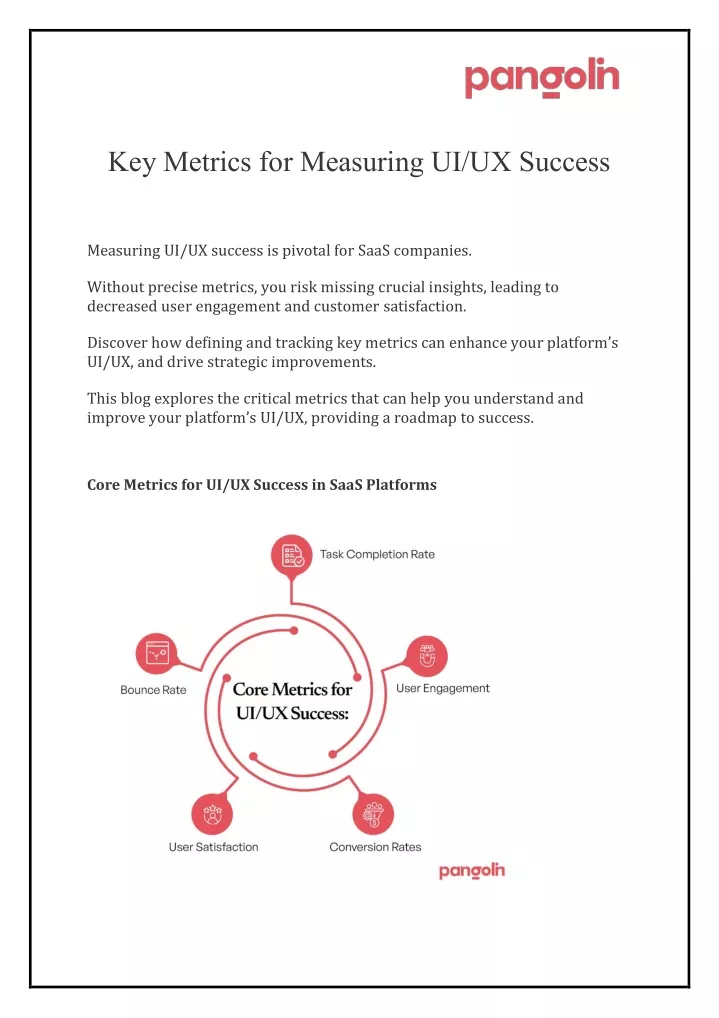
Key Metrics for Measuring UI/UX Success Measuring UI/UX success is pivotal for SaaS companies. Without precise metrics, you risk missing crucial insights, leading to decreased user engagement and customer satisfaction. Discover how defining and tracking key metrics can enhance your platform’s UI/UX, and drive strategic improvements. This blog explores the critical metrics that can help you understand and improve your platform’s UI/UX, providing a roadmap to success. Core Metrics for UI/UX Success in SaaS Platforms
To gauge the effectiveness of your SaaS platform’s UI/UX, focus on these key metrics. Each metric provides insights into user engagement, satisfaction, and usability. User Engagement Time on Site Page Views per Session Number of Active Users Metrics such as time on site and page views are critical indicators of user interest and can significantly influence efforts to simplify SaaS UI. High values in these areas typically suggest that users find the platform engaging and valuable. By analyzing these metrics, SaaS companies can gauge the effectiveness of their UI/UX and identify areas for enhancement to boost overall user engagement. Conversion Rates Sign-ups Upgrades Feature Usage These metrics provide insight into the effectiveness of the UI/UX in guiding users through desired actions. High conversion rates suggest a seamless user journey, whereas low rates may indicate potential barriers or points of confusion that need addressing to enhance the user experience. User Satisfaction (H3) Net Promoter Score (NPS) Customer Satisfaction Score (CSAT) These metrics are pivotal in understanding user sentiment towards your platform. A high NPS suggests strong user loyalty and advocacy, while a high CSAT indicates that users are generally satisfied with the services provided.
Monitoring these scores helps identify areas that may require improvements to enhance user satisfaction and loyalty. Task Completion Rate Submitting Forms Making Purchases Task completion rates are vital for assessing UI usability. High rates suggest that the UI is intuitive and user-friendly, facilitating easy completion of tasks. Conversely, low rates could indicate usability issues, pointing to areas where the UI may need improvement to enhance user experience. Bounce Rate Represents the percentage of users who leave your platform shortly after arriving High bounce rates may indicate UX problems, such as unclear navigation or poor first impressions Addressing a high bounce rate can lead to improved user retention These metrics form the foundation for assessing and enhancing your SaaS platform’s UI/UX. By monitoring these key indicators, you can identify areas for improvement and make informed decisions to improve user satisfaction and business outcomes. How to Measure Your UI/UX Metrics for SaaS UI/UX Here’s how to track your UI/UX metrics effectively and integrate them into your platform without disrupting the user experience.
Tools and Platforms to Measure UI/UX Metrics Analytics platforms like Google Analytics and Mixpanel are popular choices for tracking UI/UX metrics. These tools offer a comprehensive suite of features to monitor user engagement, conversion rates, bounce rates, and more. Analytics Tool Key Features Strengths Google Analytics Page ViewsSession DurationUser Demographics Excellent for tracking overall user engagement and bounce rates Event-based trackingSegmentationCohort Analysis Best for detailed monitoring of specific user actions and advanced user behavior analysis Mixpanel Integration into SaaS UI Integrating these tools into your SaaS UI requires careful planning to ensure seamless data collection without affecting the user experience. Tracking Mechanisms: Use tracking codes or scripts provided by the analytics platforms to capture user interactions. These codes are typically added to the header or footer of your website to track user activity on each page. Seamless Integration:To avoid disrupting the user experience, ensure that tracking codes don’t slow down your platform’s load times. Test your platform after integration to confirm smooth performance across all devices. Implementing these tools and tracking mechanisms allows you to measure crucial metrics accurately. By analyzing the collected data, you can gain valuable insights into user behavior and make informed decisions to improve your UI/UX.
Interpreting Metrics: Finding Insights in the Data Collecting data is one thing, but knowing how to interpret it is what truly drives UI/UX success. Here’s a guide on analyzing the metrics you’ve gathered and how to use UI/UX Design to improve your SaaS platform. Analyzing Data and Identifying Areas forImprovement in UI/UX Step 1: Observe Trends Over Time
Action: Regularly review key metrics like user engagement and conversion rates Purpose: Identify patterns that indicate how users interact with your platform. Consistent trends or changes during specific periods can reveal much about user behavior and preferences Step 2: Detect Anomalies Action: Monitor for unexpected spikes or drops in metrics Example: A sudden increase in bounce rates might suggest an issue with your landing page or a broader UI/UX problem Step 3: Analyze User Behavior Action: Assess how user behavior aligns with expected outcomes Questions to Consider: – Are users engaging less with new features? – Do conversion rates fluctuate with changes to the UI? Step 4: Identify Areas for Improvement Action: Compare current metrics against your goals or industry benchmarks Focus Areas: – If task completion rates are low, streamline the interface or clarify user instructions – Address drops in user satisfaction by investigating and responding to user feedback Step 5: Implement Changes and Monitor Results Action: Apply targeted changes based on your data analysis Continuous Monitoring:Regularly check the impact of these changes on your platform’s metrics to ensure positive user engagement and satisfaction Step 6: Iterate Based on Feedback
Action: Use ongoing user feedback and metric analysis to continuously refine and enhance the UI/UX Engagement: Invite users to share their experiences and suggestions, fostering a responsive and adaptive design process Step 7: Engage and Inquire Question for Engagement: What patterns have you noticed in your platform’s metrics, and what do they suggest about your UI/UX? Purpose: Encourage discussion and deeper insight into user behavior, aligning with best practices for engaging content and SEO This approach not only makes the content more engaging and readable but also structures the information in a way that’s easier for search engines to understand and index effectively. Best Practices for Using Metrics to Drive UI/UX Improvements Regular Design Reviews Schedule Periodic Reviews: Hold regular meetings to discuss collected data and assess recent design changes Involve the Entire Team: Encourage input from different team members to foster innovative solutions Focus on Key Metrics: Concentrate on metrics that reflect user behavior and satisfaction, such as conversion rates and user engagement Identify Areas for Improvement: Use the reviews to pinpoint areas needing attention and prioritize action items Prioritizing Changes Focus on High-Impact Metrics: Prioritize changes based on their influence on user experience Create a Clear Roadmap: List action items from the reviews and rank them by priority and feasibility Address Critical Issues First: Tackle the most significant problems to improve the user experience quickly Maintain Flexibility: Be open to adjusting priorities based on new insights from ongoing data collection
These best practices leverage key metrics to drive UI/UX improvements, effectively guiding your design process. To understand the comprehensive impact of professional UI/UX design services on SaaS platforms, consider how they can enhance these metrics further. Driving UI/UX Success with Metrics Tracking specific metrics is critical to the success of your SaaS platform’s UI/UX. By focusing on key indicators like user engagement, conversion rates, and user satisfaction, you can understand how your platform performs and where it needs improvement. These metrics serve as a guide, providing valuable insights that drive your UI- UX design strategies to create a better user experience and revenue. The benefits of using metrics to inform your design decisions are clear. They allow you to make data-driven choices, reduce guesswork, and improve customer satisfaction. By regularly monitoring these metrics and adjusting your approach accordingly, you can ensure your SaaS platform continues to evolve in a way that resonates with users. To put these principles into action, incorporate these practices into your ongoing design strategy. We encourage you to share your experiences and insights on using metrics to improve UI/UX. Pangolin is here to help you navigate the complexities of UI/UX design. What have you found most helpful in tracking UI/UX success, and how have metrics guided your design process? Let us know, and let’s continue the conversation on building better SaaS platforms.