Download
1 / 29
290 likes | 300 Views
Explore the statistical toolkit power of goodness-of-fit tests in the comparison of simulation vs. experimental data. Discover the validation and analysis capabilities for various distributions and tests. Gain insights into the software's vision, algorithms, and user layer.

E N D
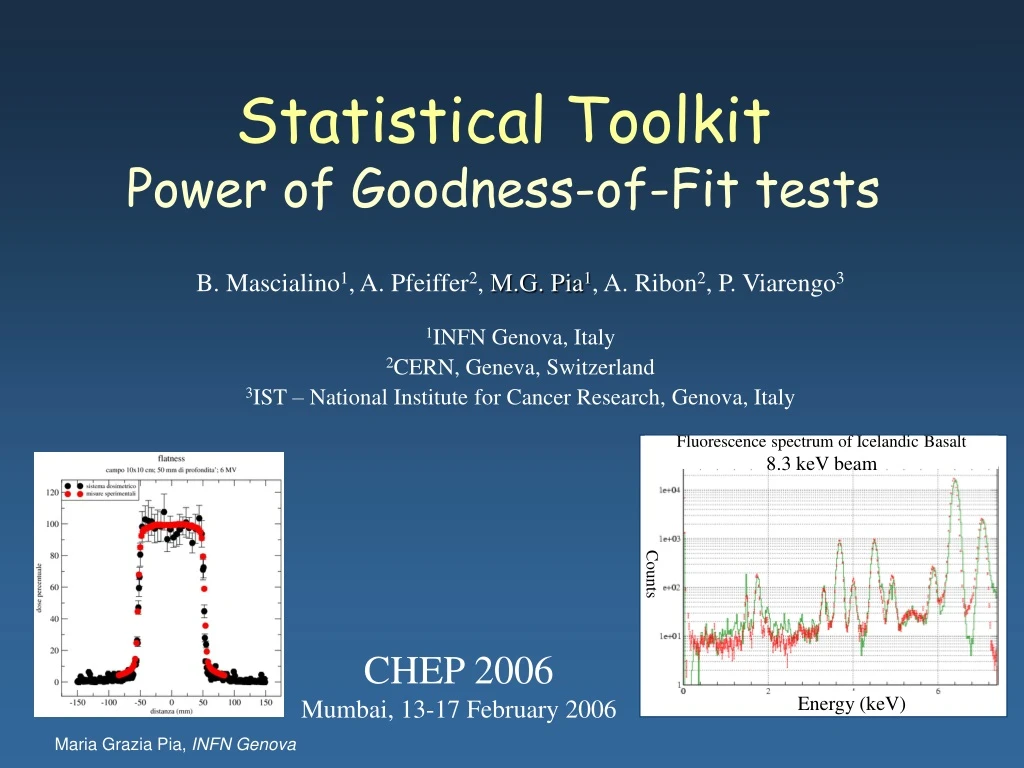
Fluorescence spectrum of Icelandic Basalt 8.3 keV beam Counts Energy (keV) Statistical ToolkitPower of Goodness-of-Fit tests B. Mascialino1, A. Pfeiffer2, M.G. Pia1, A. Ribon2, P. Viarengo3 1INFN Genova, Italy 2CERN, Geneva, Switzerland 3IST – National Institute for Cancer Research, Genova, Italy CHEP 2006 Mumbai, 13-17 February 2006
Historical background… Some use cases Validation of Geant4 physics models through comparison of simulation vs. experimental data or reference databases • Regression testing • Throughout the software life-cycle • Online DAQ • Monitoring detector behaviour w.r.t. a reference • Simulation validation • Comparison with experimental data • Reconstruction • Comparison of reconstructed vs. expected distributions • Physics analysis • Comparisons of experimental distributions (ATLAS vs. CMS Higgs?) • Comparison with theoretical distributions (data vs. Standard Model) The test statistics computation concerns the agreement between the two samples’ empirical distribution functions
Releases are publicly downloadable from the web • code, documentation etc. • Releases are also distributed with LCG Mathematical Libraries • Also ported to Java, distributed with JAS G.A.P Cirrone, S. Donadio, S. Guatelli, A. Mantero, B. Mascialino, S. Parlati, M.G. Pia, A. Pfeiffer, A. Ribon, P. Viarengo “A Goodness-of-Fit Statistical Toolkit” IEEE- Transactions on Nuclear Science (2004), 51 (5): 2056-2063.
Vision of the project • Basicvision • General purpose tool • Toolkit approach (choice open to users) • Open source product • Independent from specific analysis tools • Easily usable in analysis and other tools • Rigorous software process Clearly define scope, objectives Software quality Flexible, extensible, maintainable system Build on a solid architecture
GoF algorithms (latest public release) • Algorithms for binned distributions • Anderson-Darling test • Chi-squared test • Fisz-Cramer-von Mises test • Algorithms for unbinned distributions • Anderson-Darling test • Cramer-von Mises test • Goodman test(Kolmogorov-Smirnov test in chi-squared approximation) • Kolmogorov-Smirnov test • Kuiper test
Recent extensions: algorithms Improved tests • Fisz-Cramer-von Mises test and Anderson-Darling test • exact asymptotic distribution (earlier: critical values) • Tiku test • Cramer-von Mises test in a chi-squared approximation • It is the most complete software for the comparison of two distributions, even among commercial/professional statistics tools • goal: provide all 2-sample GoF algorithms existing in statistics literature • Publication in preparation to describe the new algorithms • Software release: March 2006 Weighted Kolmogorov-Smirnov, weighted Cramer-von Mises various weighting functions available in literature Watson test can be applied in case of cyclic observations, like the Kuiper test New tests In preparation Girone test
User Layer • Simple user layer • Shields the user from the complexity of the underlying algorithms and design • Only deal with the user’s analysis objects and choice of comparison algorithm • First release: user layer for AIDA analysis objects • LCG Architecture Blueprint, Geant4 requirement • July 2005: added user layer for ROOT histograms • in response to user requirements • Other user layer implementations foreseen • easy to add • sound architecture decouples the mathematical component and the user’s representation of analysis objects
Power of GoF tests • Do we really need such a wide collection of GoF tests? Why? • Which is the most appropriate test to compare two distributions? • How “good” is a test at recognizing real equivalent distributions and rejecting fake ones? Which test to use? • No comprehensive study of the relative power of GoF tests exists in literature • novel research in statistics (not only in physics data analysis!) • Systematic study of allexisting GoF tests in progress • made possible by the extensive collection of tests in the Statistical Toolkit
Parent distribution 1 Parent distribution 2 GoF test Sample 1 n Sample 2 m Confidence Level = 0.05 # pseudoexperiments with p-value < (1-CL) Power = # pseudoexperiments Method for the evaluation of power Pseudoexperiment: a random drawing of two samples from two parent distributions N=1000 Monte Carlo replicas For each test, the p-value computed by the GoF Toolkit derives from the analytical calculation of the asymptotic distribution, often depending on the samples sizes
Gaussian Uniform Exponential Double exponential Cauchy Contaminated Normal Distribution 1 Contaminated Normal Distribution 2 Parent distributions Also Breit-Wigner, other distributions being considered
Characterization of distributions Skewness Tailweight
General alternativeCompare different distributions Unbinned distributions Parent1 ≠ Parent2
Medium tailed vs Medium tailed Symmetric vs Simmetric Short tailed vs Medium tailed Empirical power (%) FLAT vs EXPONENTIAL DOUBLE EXPONENTIAL vs EXPONENTIAL Empirical power (%) Symmetric vs skewed Sample size CvM W KS AD K W Sample size AD No clear winner K CN1 vs CN2 DOUBLE EXPONENTIAL vs CN1 Symmetric vs Symmetric Empirical power (%) Empirical power (%) Symmetric vs Skewed Medium tailed vs Medium tailed Medium tailed vs Medium tailed Sample size Sample size The power increases as a function of the sample size
Symmetric vs Symmetric Medium tailed vs Medium tailed Symmetric vs Symmetric Medium tailed vs Long tailed Simmetric vs Simmetric GAUSSIAN vs DOUBLE EXPONENTIAL GAUSSIAN vs DOUBLE EXPONENTIAL GAUSSIAN vs CN1 Medium tailed vs Long tailed Empirical power (%) Very similar distributions Empirical power (%) Empirical power (%) CvM W KS KS CvM CvM AD K Sample size Long tailed vs Medium tailed Sample size Samples size Symmetric vs Asymmetric GAUSSIAN vs CN2 Empirical power (%) CAUCHY vs EXPONENTIAL Symmetric vs skewed Medium tailed vs Medium tailed Empirical power (%) Sample size AD CvM AD Sample size The power increases as a function of the sample size
Samples size = 5 Sample size = 5 Sample size = 15 Samples size = 15 EXPONENTIAL vs OTHER DISTRIBUTIONS EXPONENTIAL vs OTHER DISTRIBUTIONS Empirical power (%) Empirical power (%) Empirical power (%) Empirical power (%) CvM W KS AD EXPONENTIAL vs OTHER DISTRIBUTIONS EXPONENTIAL vs OTHER DISTRIBUTIONS K Tailweight 2ND distribution Tailweight 2ND distribution Tailweight 2ND distribution Tailweight 2ND distribution Empirical power (%) Empirical power (%) Empirical power (%) Empirical power (%) Tailweight 2ND distribution Tailweight 2ND distribution Tailweight 2ND distribution Tailweight 2ND distribution The power varies as a function of the parent distributions’ characteristics Distribution1 asymmetric Samples size = 15 Samples size = 5 FLAT vs OTHER DISTRIBUTIONS Distribution1 symmetric FLAT vs OTHER DISTRIBUTIONS FLAT vs OTHER DISTRIBUTIONS FLAT vs OTHER DISTRIBUTIONS
Sample size = 5 Sample size = 15 EXPONENTIAL vs OTHER DISTRIBUTIONS Empirical power (%) Empirical power (%) CvM W KS AD EXPONENTIAL vs OTHER DISTRIBUTIONS K Tailweight 2ND distribution Tailweight 2ND distribution Empirical power (%) Empirical power (%) Tailweight 2ND distribution Tailweight 2ND distribution The power varies as a function of parent distributions’ characteristics Distribution1 asymmetric Sample size = 15 Sample size = 5 FLAT vs OTHER DISTRIBUTIONS Distribution1 symmetric FLAT vs OTHER DISTRIBUTIONS
Comparative evaluation of tests Preliminary Tailweight Skewness
Location-scale alternativeSame distribution, shifted or scaled Parent1(x) = Parent2 ((x-θ)/τ)
θ =0.5, τ = 0.5 θ =0.5, τ = 1.5 EXPONENTIAL EXPONENTIAL Empirical power (%) Empirical power (%) CvM W KS Sample size Sample size AD K θ =1.0, τ = 0.5 θ =1.0, τ = 1.5 EXPONENTIAL EXPONENTIAL Empirical power (%) Empirical power (%) Sample size Sample size Power increases as a function of sample size CvM KS K W CvM No clear winner KS
CvM W KS AD K Power increases as a function of sample size θ =0.5, τ = 0.5 θ =0.5, τ = 1.5 CN2 CN2 W K Empirical power (%) Empirical power (%) Sample size Sample size θ =1.0, τ = 1.5 θ =1.0, τ = 0.5 CN2 CN2 No clear winner Empirical power (%) Empirical power (%) Sample size Sample size
θ =0.5, τ = 0.5 θ =0.5, τ = 1.5 N=10 N=10 Empirical power (%) Empirical power (%) Tailweight CvM W KS Tailweight AD K θ =1.0, τ = 1.5 θ =1.0, τ = 0.5 N=10 N=10 Empirical power (%) Empirical power (%) Tailweight Tailweight Power decreases as a function of tailweight No clear winner No clear winner
Binned distributions General alternativeCompare different distributions Parent1 ≠ Parent2
Chi-squared test: POWER % Samples size = 500 Number of bins = 20
Preliminary results • No clear winner for all the considered distributions in general • the performance of a test depends on its intrinsic features as well as on the features of the distributions to be compared • Practical recommendations • first classify the type of the distributions in terms of skewness and tailweight • choose the most appropriate test given the type of distributions • Systematic study of the power in progress • for both binned and unbinned distributions • Topic still subject to research activity in the domain of statistics • Publication in preparation
CvM CvM CvM W W W KS KS KS AD AD AD K K K Surprise… Inefficiency Flat Inefficiency Gaussian Inefficiency Exponential General alternative, same distributions CL = 95%, expect 5% inefficiency Anderson-Darling exhibits an unexpected inefficiency at low numerosity Not documented anywhere in literature! Limitation of applicability?
Outlook • 1-sample GoF tests (comparison w.r.t. a function) • Comparison of two/multi-dimensional distributions • Systematic study of the power of GoF tests • Goal to provide an extensive set of algorithms so far published in statistics literature, with a critical evaluation of their relative strengths and applicability • Treatment of errors, filtering • New release coming soon • New papers in preparation • Other components beyond GoF? Suggestions are welcome…
Conclusions • A novel, complete software toolkit for statistical analysis is being developed • rich set of algorithms • sound architectural design • rigorous software process • A systematic study of the power of GoF tests is in progress • unexplored area of research • Application in various domains • Geant4, HEP, space science, medicine… • Feedback and suggestions are very much appreciated • The project is open to developers interested in statistical methods
IEEE Transactions on Nuclear Sciencehttp://ieeexplore.ieee.org/xpl/RecentIssue.jsp?puNumber=23 • Prime journal on technology in particle/nuclear physics • Review process reorganized about one year ago • Associate Editor dedicated to computing papers • Various papers associated to CHEP 2004 published on IEEE TNS Papers associated to CHEP 2006 are welcome Manuscript submission:http://tns-ieee.manuscriptcentral.com/ Papers submitted for publication will be subject to the regular review process Publications on refereed journals are beneficial not only to authors, but to the whole community of computing-oriented physicists Our “hardware colleagues” have better established publication habits… Further info: Maria.Grazia.Pia@cern.ch