Download
1 / 28
380 likes | 565 Views
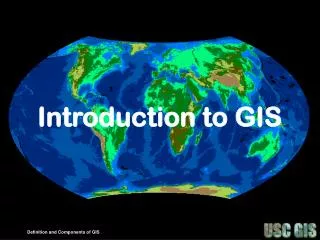
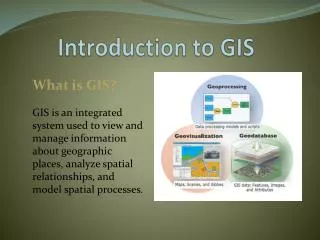
Introduction To GIS. with Karl Krauter. An organized collection of computer hardware software, geographic data, and personnel designed to efficiently capture, store, update, manipulate, analyze, and display all forms of geographically referenced information. WHAT IS A GIS ?.

E N D
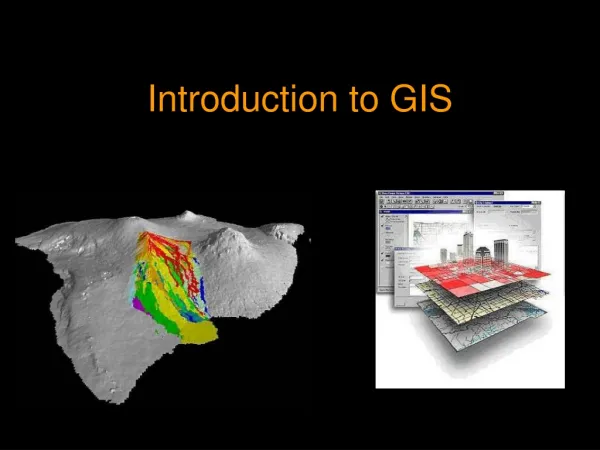
Introduction To GIS with Karl Krauter
An organized collection of computer hardware software, geographic data, and personnel designed to efficiently capture, store, update, manipulate, analyze, and display all forms of geographically referenced information. WHAT IS A GIS ? WHAT IS A GIS ?
G Geographic: A location somewhere on , above, or below the Earth. Qualities or attributes of a geographic location. I Information: System: Tools used to develop, query, and display geographic information. S
Tools include: • Hardware Digitizers Scanners Plotters PC UNIX MAC Software Arc/Info ArcView People Networked with others Training
G I S is a process which looks at the relationships of layers by asking questions questions questions: Who is within a distance of... What would happen if... When was the last time... Where is a specific location of... How far from one location to another... How many occurrences of an event are within a distance of a location.
Examples of GIS questions asked Desert Game Range What is the total area of industrial minerals ? Potential Radon Hazard Where are the potential radon hazards ? Earthquake Scenario What would happen in Reno if a 7.1 earthquake happened on the Carson Valley Fault range Earthquake Event How many events happened in 1976
The Question: Hands on GIS Find all the areas of possible avalanche where south facing slopes are greater than 30%, and are within 150 meters of a major road. To find the answer to this GIS question What layers / themes are needed ? DEMs Major roads
Hands On ArcView 3.2 • Project Window • View Window • Table Window • Charts Window • Layout Window • Script Window
Announcements: ArcView is available for $250.00 for each module Call E.S.R.I. 1-888-377-4575 Ext. 1499 you will need to fax your class schedule
G I S What is it ? It is a process which looks at the relationships between layers of geographic information
G I S An organized collection of computer hardware, software, geographic data, and personnel designed to efficiently capture, store, update, manipulate, analyze, and display all forms of geographically referenced information.
LAYERS A layer is a theme of various features: + + Locations (points) + An x,y value Lines (arcs) A series of x,y locations Areas (polygons) A closed series of x,y locations Images (raster) TIFF DEM Grids
Feature Class - Points An x,y location
Feature Class - Line A series of x,y locations
Feature Class - Area (polygons) A series of x,y locations that are closed
Introduction to ArcView What is it? How does it work?
Analysis • Attribute Query – Non Spatial Analysis • Spatial Query • Spatial Join • Theme on Theme • Within a distance • Are completely within • Buffer Analysis • Boolean Analysis (Raster)
Data Management Metadata Scale Why doesn’t my data fit? Projection Why doesn’t my data fit? Data Creation Why doesn’t my data fit? Metadata is data about your data. is data about your data.
Data Input Various methods: Digitize Tablet Digitize On Screen digitizing Digitize in a desktop type program Scanning Take from other source
What is available in additional training ? University of Nevada, Reno Introduction To G I S Spring / Fall Short course in GIS Summer TMCC - Various short courses in ArcView WNCC - Intro To GIS, Fall E.S.R.I. - Various week long classes Internet classes - www.esri.com Some other locations in Canada GIS questions: krauter@unr.edu
Recommended Books • “Getting to Know ArcView GIS” by Pat Breslin, Nick Frunzi, Eileen Napoleon, and Tim Ormsby • “ArcView Exercise Book”, by Pat Hohl with Brad Mayo
What is the question ? Find all the areas of possible avalanche where south facing slopes are greater than 30%, and are within 150 meters of a major road. Do your results seem reasonable ?
Data Manipulation Two data layers joined together to produce another data layer Data that intersects other data Data that falls within a distance of other data
How do you want others to view your results? In ArcView -> Layouts -> -> Who is your audience ? What colors or line type presents my results best?