Download
1 / 44
440 likes | 605 Views
Investing Basics. October 6, 2008. Why do we invest?. Capital Preservation Building Wealth, Retirement Take Advantage of Time and Compounding Savings Rate. Compound Interest. Investor A: Starts contributing $2,000 annually to an IRA at the age of 26.

E N D
Investing Basics October 6, 2008
Why do we invest? Capital Preservation Building Wealth, Retirement Take Advantage of Time and Compounding Savings Rate
Compound Interest • Investor A: Starts contributing $2,000 annually to an IRA at the age of 26. • Investor B: Contributes $2,000 per year to an IRA beginning at age 19 and ending at age 25. • Earn 10% per year. • Who ends up with more more at age 65?
Investor B Ends up with More Money than Investor A Adapted from Richard Russell: http://ww2.dowtheoryletters.com/DTLOL.nsf/htmlmedia/body_rich_man__poor_man.html
Morals of the Story • Start saving and investing as early as possible. • At a young age, savings rate is probably the most important factor in building wealth (although investing responsibly helps too). • (The moral isn’t necessarily to stop investing after age 25. Consider that a hypothetical investor C who started investing $2,000 annually at age 19 would have ended with nearly $2 million.)
Active vs. Passive Management Definitions Advantages and Disadvantages Investing in Funds
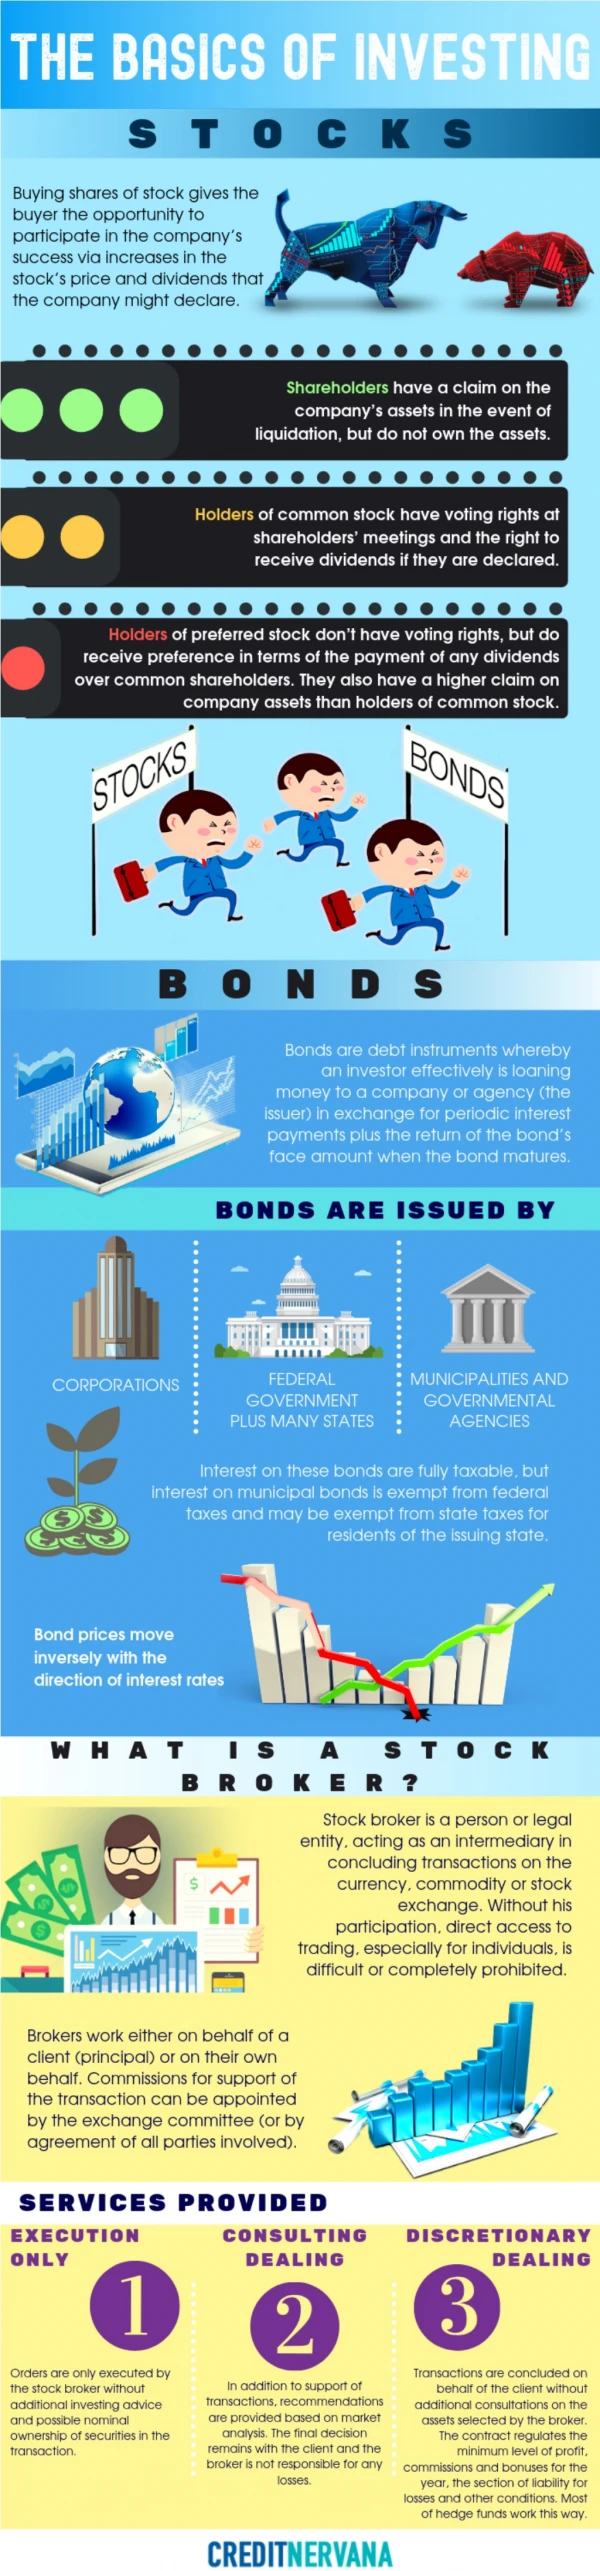
What do these terms mean? • Active Management • The use of an active means such as stock selection or market timing in an attempt to outperform the market. • Passive Management • Matches the return of a given market index by owning all (or substantially all) the securities in the underlying index.
Active Management • Incentive Problems: • Fee structure. • Risk. • Higher fees in general. • Higher turnover and lower tax efficiency. • Most actively managed funds underperform passive indexes over time. • It’s also hard to pick funds that will be long term winners.
Advantages of Index Funds • Guaranteed market rate of return. • Diversified. Eliminates idiosyncratic risk. • Low expenses. • Usually tax efficient. • Easy to build a portfolio based on your risk tolerance.
Exchange Traded Funds (ETFs) • Advantages of Index-Tracking ETFs: • Low ERs. • No minimums. • Traded on an exchange like stocks. • Pay same commission as a regular trade. • Examples of Index-Tracking ETFs: • VTI – Vanguard Total Stock Market (0.07%) • IVV – iShares S&P 500 Index Fund (0.09%) • VEU – Vanguard FTSE All World Ex-US (0.25%)
Index Mutual Funds • Higher minimums. • Better for small, frequent purchases (DCA). • Only priced and traded at the close of the day. • Vanguard (generally $3,000 minimum).
Investing Basics Business Analysis Accounting Analysis Financial Analysis Valuation
Business Analysis • Remember last week? • Procter & Gamble • Competitive advantages? • Brand names? • Ability to raise prices with inflation? • Economic moat? • Industry and type of product? • Consistency?
Accounting Analysis • Do the firm’s accounting policies reflect the business reality of the firm? • If not, we must make adjustments. • More on accounting analysis later. Yes, it needs its own week (or two..).
Financial Statements • Balance Sheet: A list of the things owned and owed by the firm and the difference between the two. • Income Statement: A list of the resources acquired and consumed by a firm over a period of time. • Cash Flow Statement: A list of the flows of cash in and out of a company over a period of time.
Basic Accounting Terms • Balance Sheet • Assets: Probable future benefits owned or controlled by a firm. • Liabilities: Probable future sacrifice of benefits. • Equity: The difference between total assets and total liabilities. • Income Statement • Earnings: The increase in net assets (equity) resulting from operations over a period of time.
Things to Remember • The Balance Sheet Equation: • Assets = Liabilities + Equities • Equity is the residual left over for shareholders after a company’s other creditors (represented by liabilities) have been satisfied. • One of the best sources of information is the company itself and its management. • This means reading annual and quarterly reports, which can be found on SEC.gov or on the company’s website. • We still need to be cognizant of management’s incentives and biases.
Value Line Accessible via OSU libraries and ccig.osu.edu.
Reminders About Value Line • Good starting point. • Usually a reliable source for objective data aggregated in a consistent format. • It’s generally a good idea to ignore Value Line’s predictions (or any analyst predictions for that matter).
The Basics of a Stock • Share of Stock: A security representing fractional ownership in a firm and a claim on its net assets and earnings. • Shares Outstanding: The total number of shares issued by a company. • Market Capitalization (Market Cap): • The total market value of a company based on the share price and number of shares outstanding. • Share Price x Number of Shares Outstanding.
Market Cap $67.28 x 3,033 m = $204 bn
Implications • Share Price • One share of P&G costs $67.28. • Shares Outstanding • There are about 3 billion shares outstanding, so if you buy one share, you’re buying 1 / 3 billionth of the company. • Market Cap • The total market value of P&G (based on the share price and shares outstanding) is $204 billion.
Earnings • Definition Again: The increase in net assets (equity) resulting from operations over a period of time. • Earnings per Share (EPS) = Earnings / Number of Shares • Price to Earnings Ratio (P/E Ratio) = Share Price / Earnings per Share • Earnings Yield = Earnings per Share / Share Price
Earnings per Share EPS = Earnings / Shares Outstanding
P/E Ratio P/E Ratio = Share Price / EPS
Earnings Yield Earnings Yield = EPS / Shares Outstanding
Implications • P/E Ratio • You’re paying $18.10 per dollar of P&G’s earnings. • Depends on factors such as expected growth and industry. • Earnings Yield • The initial yield you’re earning on your investment is 5.5%. • Since the earnings yield is the reciprocal of the P/E ratio, a lower P/E ratio results in a higher earnings yield. • Note: You might run those calculations and end up with numbers slightly different than those reported by Value Line because they use a weighted average of shares outstanding.
Dividend • Definition: A distribution of earnings to shareholders. • Dividend per Share: Amount paid per share (usually per year). • Dividend Yield: Dividend per Share / Share Price • Payout Ratio: Dividend per Share / Earnings per Share
Dividends Payout Ratio = Dividend per Share / EPS
Implications • Dividends in General • Considered to be indicative of stability. • Earnings not paid out as dividends can be reinvested. • Dividend per Share • The amount paid to you by the company (in cash) per year. • Dividend Yield • The amount of the dividend relative to the share price. • The yield (extra return) you will receive from the dividend. • Payout Ratio • Tells us how much of the company’s earnings are being paid out as dividends. • The remainder (1 – payout ratio) is reinvested in the business.
Book Value of Equity • Refers to the value of equity recorded on the balance sheet. • Also interchangeable with equity, remember: • Equity = Assets – Liabilities • Book Value per Share = Book Value / Number of Shares • Price to Book Ratio (P/B Ratio) = Share Price / Book Value per Shares
Book Value P/B Ratio = Price / Book Value per Share
Implications • Book Value • Broadly refers to values assigned to various entries on a firm’s balance sheet. • Sometimes requires adjustments (for example, book value of equity often requires the deduction of intangible assets that cannot be readily priced and sold). • P/B Ratio • Above 1 indicates that the firm is priced at a value greater than the book value of its net assets. • Most firms trade at a market value above book value. • Intangibles and other advantages can result in a higher P/B ratio. • High or low P/B ratio does not necessarily make something a good or bad investment.
Measuring Return on Investment (ROI) • Return on Equity (ROE) = Net Income / Book Value of Equity • Return on Assets (ROA) = Net Income / Total Assets • There are a few more, but we can save those for later.
Return on Equity ROE = Net Income / Book Value of Equity
Implications • Return on Equity • A (relatively) comprehensive measure of how profitable a firm is in relation to money invested by shareholders. • We prefer an above-average ROE. • Return on Assets • Measures a firm’s profitability relative to its total assets. • Differences Between ROE and ROA are generally caused by leverage, which can enhance a firm’s ROE. • We will break down these ratios later.
Don’t Feel Overwhelmed. • We covered a LOT of material today. • It takes time for these concepts to sink in. • After a few more meetings and some outside reading, you’ll catch on quickly. • This PowerPoint will be posted online for future reference and review. • Outside of meetings, ask questions on the Forum!
Some Recommended Reading for the Mean Time • The Wall Street Journal • The Superinvestors of Graham-and-Doddsvilleby Warren Buffett • The Dhandho Investor by MohnishPabrai • The Intelligent Investor by Benjamin Graham • Margin of Safety by Seth Klarman
Next Week • Getting Started • Choosing a Broker • Account Types • More on Investing in Funds • Starting the Club Portfolio • Look at Core-Mark (CORE)
ccig.osu.edu October 6, 2008


![READ [PDF] Dividend Investing For Beginners: Learn The Basics Of Dividend Investing And](https://cdn7.slideserve.com/12651654/slide1-dt.jpg)