Download
1 / 43
430 likes | 748 Views
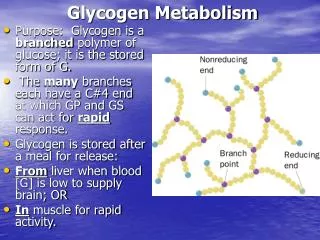
Glycogen Metabolism. Chapter 18. glycogen phosphorylase activation: glycogen converted to G-1-P. Figure 18-22 The enzymatic activities of phosphorylase a and glycogen synthase in mouse liver in response to an infusion of glucose. Page 648.

E N D
Glycogen Metabolism Chapter 18
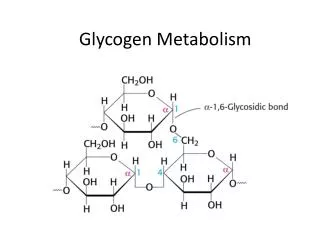
glycogen phosphorylase activation: glycogen converted to G-1-P
Figure 18-22 The enzymatic activities of phosphorylase a and glycogen synthase in mouse liver in response to an infusion of glucose. Page 648
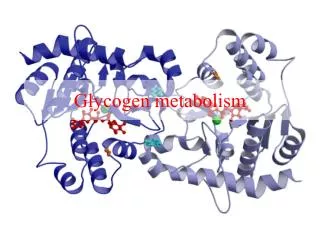
Figure 18-2c X-Ray structure of rabbit muscle glycogen phosphorylase. (c) An interpretive “low-resolution” drawing of Part b showing the enzyme’s various ligand-binding sites. Page 628
Figure 19-21 Schematic diagram of a typical mammalian AC. Page 682
Figure 19-57 Activation of PKC. Page 713
Figure 18-9 The control of glycogen phosphorylase activity. Page 635
Figure 18-13 Schematic diagram of the major enzymatic modification/demodification systems involved in the control of glycogen metabolism in muscle. Page 639
Figure 18-19 Schematic diagram of the Ca2+–CaM-dependent activation of protein kinases.
Figure 18-24 Formation and degradation of -D-fructose-2,6-bisphosphate as catalyzed by PFK-2 and FBPase-2. Page 649
Figure 18-26b The liver’s response to stress. (b) The participation of two second messenger systems. Page 652
In response to stress (i.e., release of epinephrine) the liver EXPORTS glucose(to muscle tissue: “fight or flight”)
Figure 18-21 The antagonistic effects of insulin and epinephrine on glycogen metabolism in muscle. Page 645
Maintaining Blood Glucose Levels • During exercise or long after meals, the liver releases glc into the bloodstream • Glc inhibits pancreatic -cells from secreting glucagon. Inhibition is released when glc levels fall. • Glucagon receptors on liver cells respond to glucagon binding by activating AC causing [cAMP]. • [cAMP] increases the rate of glycogen breakdown and increased G6P. • G6P cannot pass through cell membranes. However, the liver, which doesn’t rely on glc for a major energy source, has a G6P hydrolase to release glc.
Figure 18-27 The ADP concentration in human forearm muscles during rest and following exertion in normal individuals and those with McArdle’s disease. Page 653
Figure 18-26a The liver’s response to stress. (a) Stimulation of -adrenoreceptors by epinephrine activates phospholipase C to hydrolyze PIP2 to IP3 and DAG. Page 652
Figure 18-26a The liver’s response to stress. (a) Stimulation of -adrenoreceptors by epinephrine activates phospholipase C to hydrolyze PIP2 to IP3 and DAG. Page 652
Figure 19-1a Classification of hormones. (a) Endocrinesignals are directed at distant cells through the intermediacy of the bloodstream. Page 658
Figure 19-1b Classification of hormones. (b) Paracrine signals are directed at nearby cells. Page 658
Figure 19-1c Classification of hormones. (c) Autocrine signals are directed at the cell that produced them. Page 658
Figure 19-2Major glands of the human endocrine system. Page 658
Table 19-1 (continued) Some Human Hormones – Polypeptides. Page 659
Table 19-1(continued) Some Human Hormones – Steroids. Page 659
Table 19-1 (continued) Some Human Hormones – Amino Acid Derivatives. Page 659
Fig. 19-16 Receptor-mediated activation/inhibition of Adenylate Cyclase
Figure 19-13 Activation/deactivation cycle for hormonally stimulated AC. Page 674
Figure 19-14 General structure of a G protein-coupled receptor (GPCR). Page 674
Figure 19-51 Role of PIP2 in intracellular signaling. Page 708
Figure 19-21 Schematic diagram of a typical mammalian AC. Page 682
Figure 19-50 Molecular formula of the phosphatidylinositides. Page 707
Figure 19-52 A phospholipase is named according to the bond that it cleaves on a glycerophospholipid. Page 709
Figure 19-57 Activation of PKC. Page 713