Download
1 / 24
240 likes | 457 Views
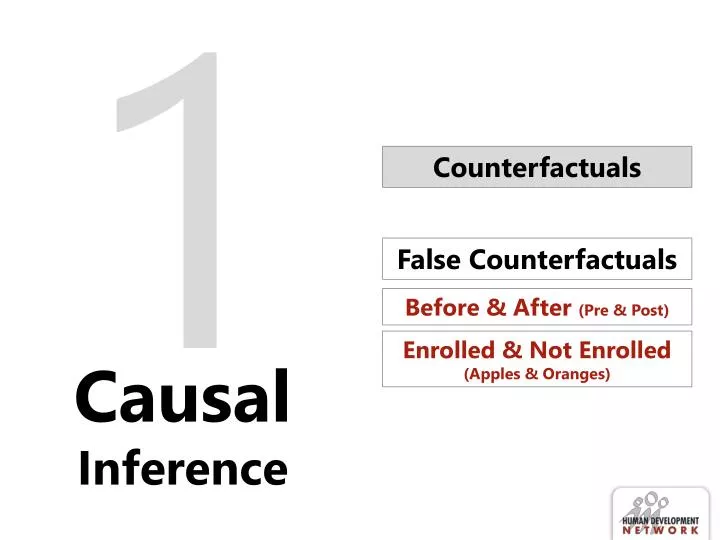
1. Counterfactuals. False Counterfactuals. Before & After (Pre & Post). Enrolled & Not Enrolled (Apples & Oranges). Causal Inference. Estimate the causal effect (impact) of intervention (P) on outcome (Y). (P) = Program or Treatment (Y) = Indicator, Measure of Success.

E N D
1 Counterfactuals False Counterfactuals Before & After (Pre & Post) Enrolled & Not Enrolled (Apples & Oranges) Causal Inference
Estimate the causal effect (impact) of intervention (P) on outcome (Y). (P) = Program or Treatment (Y) = Indicator, Measure of Success Our Objective “ Example: What is the effect of a Cash Transfer Program(P)on Household Consumption (Y)?
Causal Inference What is the impact of (P) on (Y)? α= (Y | P=1)-(Y | P=0) Can we all go home?
Problem of Missing Data α= (Y | P=1)-(Y | P=0) For a program beneficiary: we observe (Y | P=1): Household Consumption (Y) with a cash transfer program (P=1) but we do not observe (Y | P=0): Household Consumption (Y) without a cash transfer program (P=0)
Estimate what would have happened to Y in the absence of P. We call this the Counterfactual. Solution • The key to a good impact evaluation is a valid counterfactual!
Estimating impact of Pon Y α= (Y | P=1)-(Y | P=0) ESTIMATE (Y | P=0) The Counterfactual OBSERVE (Y | P=1) Outcome with treatment IMPACT = - counterfactual Outcome with treatment • Intention to Treat (ITT) –Those offered treatment • Treatment on the Treated (TOT) – Those receiving treatment • Use comparison or control group
giving Fulanito Example: What is the Impact of… additional pocket money (P) on Fulanito’s consumption of candies (Y)?
The Perfect Clone Fulanito Fulanito’s Clone 6 candies 4 candies IMPACT=6-4=2 Candies
In reality, use statistics Treatment Comparison Average Y=6 candies Average Y=4 Candies IMPACT=6-4=2 Candies
We want to find clones for the Fulanitos in our programs. The treatment and comparison groups should have identical characteristics except for benefiting from the intervention. In practice, use program eligibility & assignment rules to construct valid counterfactuals With a good comparison group, the only reason for different outcomes between treatments and controls is the intervention (P) Finding good comparison groups
Case Study: Progresa • National anti-poverty program in Mexico • Started 1997 • 5 million beneficiaries by 2004 • Eligibility – based on poverty index • Cash Transfers • Conditional on school and health care attendance.
Case Study: Progresa • Rigorous impact evaluation with rich data • 506 communities, 24,000 households • Baseline 1997, follow-up 2008 • Many outcomes of interest • Here: Consumption per capita • What is the effect of Progresa (P) on Consumption Per Capita (Y)? • If impact is a reduction of $20 or more, then scale up nationally
Eligibility and Enrollment Ineligibles (Non-Poor) Eligibles (Poor) Not Enrolled Enrolled
1 Counterfactuals False Counterfactuals Before & After (Pre & Post) Enrolled & Not Enrolled (Apples & Oranges) Causal Inference
Counterfeit Counterfactual #1 Before & After Y A A-C = 2 C (counterfactual) IMPACT? A-B = 4 B Time T=0 Baseline T=1 Endline
Case 1: Before & After What is the effect of Progresa (P) on consumption (Y)? Y 268 A (1) Observe only beneficiaries (P=1) (2) Two observations in time: Consumption at T=0 and consumption at T=1. α = $35 233 B Time T=1997 T=1998 IMPACT=A-B= $35
Case 1: Before & After Note: If the effect is statistically significant at the 1% significance level, we label the estimated impact with 2 stars (**).
Case 1: What’s the problem? Y • Economic Boom: • Real Impact=A-C • A-B is an overestimate 268 A Impact? α = $35 • Economic Recession: • Real Impact=A-D • A-B is an underestimate C? Impact? 233 B D ? Time T=0 T=1 • Before & After doesn’t control for other time-varying factors!
1 Counterfactuals False Counterfactuals Before & After (Pre & Post) Enrolled & Not Enrolled (Apples & Oranges) Causal Inference
False Counterfactual #2 • Enrolled & Not Enrolled • If we have post-treatment data on • Enrolled: treatment group • Not-enrolled: “control” group (counterfactual) • Those ineligible to participate. • Those that choose NOT to participate. • Selection Bias • Reason for not enrolling may be correlated with outcome (Y) • Control for observables. • But not un-observables! • Estimated impact is confounded with other things.
Case 2: Enrolled & Not Enrolled Measure outcomes in post-treatment (T=1) Ineligibles (Non-Poor) Eligibles (Poor) Not Enrolled Y=290 Enrolled Y=268 In what ways might E&NE be different, other than their enrollment in the program?
Case 2: Enrolled & Not Enrolled Note: If the effect is statistically significant at the 1% significance level, we label the estimated impact with 2 stars (**).
Progresa Policy Recommendation? Will you recommend scaling up Progresa? B&A: Are there other time-varying factorsthat also influence consumption? E&BNE: • Are reasons for enrolling correlated with consumption? • Selection Bias. Note: If the effect is statistically significant at the 1% significance level, we label the estimated impact with 2 stars (**).
! Keep in Mind B&A E&NE Compare: Same individuals Before and After they receive P. Compare: Group of individuals Enrolled in a program with group that chooses not to enroll. Problem: Other things may have happened over time. Problem: Selection Bias. We don’t know why they are not enrolled. Both counterfactuals may lead to biased estimates of the impact.