Download
1 / 19
190 likes | 330 Views
Status of Stochastic Search with LIGO. Vuk Mandic on behalf of LIGO Scientific Collaboration Caltech GWDAW-10, 12/15/05. Stochastic Background of Gravitational Waves. Energy density: Characterized by log-frequency spectrum: Related to the strain spectrum: Strain scale:.

E N D
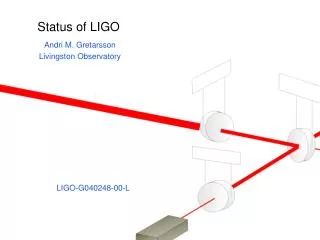
Status of Stochastic Search with LIGO Vuk Mandic on behalf of LIGO Scientific Collaboration Caltech GWDAW-10, 12/15/05
Stochastic Background of Gravitational Waves • Energy density: • Characterized by log-frequency spectrum: • Related to the strain spectrum: • Strain scale:
Detection Strategy • Cross-correlation estimator • Theoretical variance • Optimal Filter Overlap Reduction Function For template: Choose N such that:
Analysis Details • Data divided into segments: • Yi and i calculated for each interval i. • Weighed average performed. • Sliding Point Estimate: • Avoid bias in point estimate • Allows stationarity cut • Data manipulation: • Down-sample to 1024 Hz • High-pass filter (40 Hz cutoff) • 50% overlapping Hann windows: • Overlap in order to recover the SNR loss due to windowing. i i i+1 i+2 i-1 Yi
S3 Results (1) • LIGO S3 run took place between 31 Oct 2003 and 9 Jan 2004. • Used H1-L1 pair, 60-sec segments, with ¼ Hz resolution. • Notched: • 60 Hz harmonics • 16 Hz harmonics • Pulsar lines • After Δσ cut, 218 hours of exposure. • Procedure verified by successfully recovering hardware and software injections! Δσ cut:
S3 Results (2) h100=0.72
S3 Results (3) Running Point Estimate Cross-Correlation Spectrum (α=0) CC spectrum (arb) Ωgw 103 Ωgw 103 Cumulative Analysis Time (hr) Frequency (Hz)
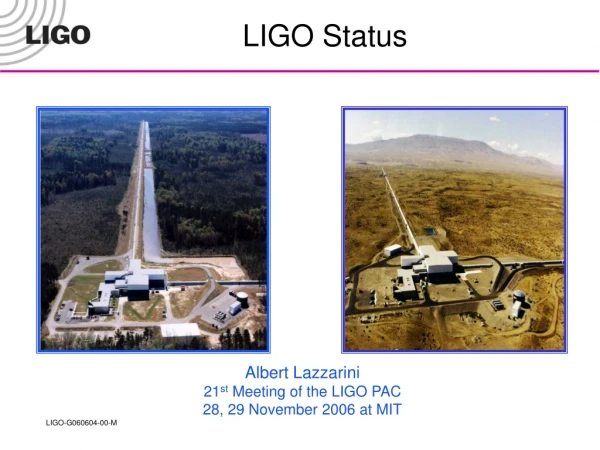
Since Then… • Significant improvements in interferometer sensitivities: • Laser power increase • Active seismic isolation at LLO… • Factor of ~10 improvements at some frequencies. • LIGO S4 science run took place between 22 Feb 2005 and 23 Mar 2005. • Since March, further improvements were made to all interferometers: • Year-long science run (S5) at design sensitivity has started in November 2005!
S4: H1L1 Coherence • Calculated over all of S4. • Using the same data as in stochastic analysis. • At 1 mHz resolution, many 1 Hz harmonics are observed. • Sharp features, not visible at 0.1 Hz resolution. • One source was the GPS synchronization signal. • Expect improvement for S5. • Also see simulated pulsar lines. 1 mHz resolution 0.1 Hz resolution
S4: H1L1 Coherence Coherence Histogram at 1 mHz • Calculated over all of S4. • Using the same data as in stochastic analysis. • At 1 mHz resolution, many 1 Hz harmonics are observed. • Sharp features, not visible at 0.1 Hz resolution. • One source was the GPS synchronization signal. • Expect improvement for S5. • Also see simulated pulsar lines.
S4: H2L1 Coherence H2L1: fewer 1 Hz harmonics. 1 mHz resolution 0.1 Hz resolution
S4: Frequency Notching • To avoid the 1 Hz harmonics: • Use 1/32 Hz resolution instead of ¼ Hz. • Use 192-sec segments instead of 60-sec segment. • PSD’s calculated by averaging 22 periodograms (50% overlapping). • Bias increases from ~2.1% to ~5.6%. • Notch 1 bin for: • 1 Hz harmonics • 60 Hz harmonics • Simulated pulsar lines • Lose ~3% of the total bandwidth.
S4: Data Cleaning • Using 60-sec analysis: • Require |σi±1 – σi| / σi < 20%. • Reject segments with large variance. • Reject a handful of segments identified to contain glitches in coherence studies. • Use the above bad 60-sec segments to identify bad 192-sec segments. • Repeat independently for H1L1 and H2L1. • Reject about 20% of the data.
S4: Gaussianity Checks • The residuals follow Gaussian distribution. • Kolmogorov-Smirnov statistic: 81%
S4 Hardware Injections - “On-the-fly” injection code bug introduced LHO-LLO relative time-shift. - Estimates of σ may change up to 10% due to calibration updates.
S4 Software Injections • 10 trials at each amplitude. • Random relative shift in each trial, to properly sample distribution. • Using a subset of S4 data. • Theoretical variance agrees well with empirical standard deviation. Measured Injected
Expected Sensitivities • H1L1: σΩ = 4.3 × 10⁻⁵ • H2L1:σΩ = 1.1 × 10⁻⁴ • Weighed average of H1L1 and H2L1 results: • Separately for EACH frequency bin. • Weights: 1/variance(f). • Optimize frequency range to include 99% of sensitivity integrand. • Combined: σΩ = 4.1 × 10⁻⁵ • h = 0.72 • Bias factor: 1.0556 • Frequency band: 51-150 Hz • The theoretical errors may change by up to 10% due to calibration updates.
Reach as a Function of Spectral Slope • S3 H1L1: Bayesian 90% UL on Ω for three values of . • Expected S4: using measured combined H1L1+H2L1 sensitivity. • Expected S5: design strain sensitivity and 1 year exposure. • For H1L1, sensitivity depends on frequency band. • Expected AdvLIGO: 10x better strain sensitivity than Initial LIGO design, and 1 year exposure.
Conclusion • Significant improvements in interferometer sensitivity since S3. • S4 all-sky stochastic search under way. • Only minor differences as compared to S3: • Data “cleaning” – selecting good times, frequency notching… • 192-sec vs 60-sec segments. • 1/32 Hz resolution vs ¼ Hz resolution. • Combining H1L1 and H2L1. • Expect about 10x more sensitive result than S3. • Also under way: • Directional search. • Attempts to estimate/suppress instrumental correlation of collocated interferometers at Hanford, WA. • Search at 1 FSR ~ 37 kHz.