Download
1 / 9
90 likes | 247 Views
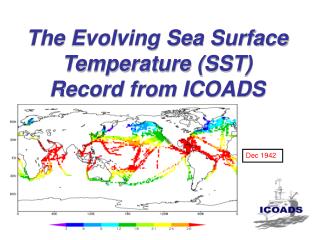
Sea Surface Temperature Analyses. Richard W. Reynolds. NOAA’s National Climatic Data Center Asheville, NC. Decadal Global In Situ SST Coverage Maximum: 120 months per decade. Extended Reconstruction SST (ERSST). Uses ship and buoy SST data Monthly 2 o gridded fields from 1854 to present

E N D
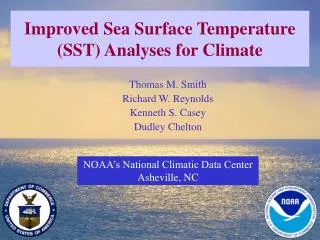
Sea Surface TemperatureAnalyses Richard W. Reynolds NOAA’s National Climatic Data Center Asheville, NC
Decadal Global In Situ SST CoverageMaximum: 120 months per decade
Extended Reconstruction SST (ERSST) Uses ship and buoy SST data Monthly 2o gridded fields from 1854 to present Purpose: to monitor climate change
Climate SST Contour Intervals: 0, 5, 10, 15, 20, 25, 28
Top: AVHRR Pathfinder Bottom: AMSR-E • For AVHRR: • Absolute latitudes > 40° have roughly only 5 days of data • Number of days increases toward the tropics • Drop offs due to cloud cover • For AMSR: • Absolute latitudes > 40° have more than 20 days of data • Drop offs due to precipitation in ITCZ and SPCZ Jan '03: Number of Days with Nighttime Obs 5
Magnitude of Gradient:Gulf Stream • Daily OI using AMSR-E for January - March 2003 • Gradients have a stationary part due to topography • Thus, limited AVHRR data are useful
AVHRR-only OI AMSR+AVHRR OI Left: Pathfinder AVHRR OI Right: Pathfinder AVHRR + AMSR-E OI Daily OI SST AnomaliesEOT satellite bias correction • 27 August: Katrina • Weak anomaly in Gulf in Path + AMSR-E • 28 August: Katrina • Strong anomaly in Path + AMSR-E • 29 August: Katrina • Strong anomaly in Path + AMSR-E • Modest anomaly in Path 7
Daily OI: ProductsAll products on 0.25° spatial grid • AVHRR only • AVHRR Daily OI: September 1981 to present • AMSR + AVHRR • AMSR + AVHRR Daily OI: June 2002 to present • Both products use satellite & in situ data