Download
1 / 26
260 likes | 371 Views
multi Learn. toby Escarez ethan Faust jacob Mrozek ji Mun chris Patterson anirudh Srinivas calder Thami. In 2008, the national average ratio of students to computers was about 3.8 Teachers have difficulty gauging student performance over time

E N D
multiLearn toby Escarez ethan Faust jacob Mrozek ji Mun chris Patterson anirudh Srinivas calder Thami
In 2008, the national average ratio of students to computers was about 3.8 • Teachershave difficulty gauging student performance over time • Parents would like to know how their kids are doing more regularly The Problem
Educational program • Originally developed for use in India • Allows 4 students to use a computer • No way to view statistics… Introducing multiLearn
Teachers in Seattle schools • Internet connected computers • ~3.8 to 1 ratio (students to computers) • 4th - 5th grade students • Experienced with computers • Seattle parents • Home internet access Target Users
Online access is essential • Feedback is more important than grading • Info provided by current systems can be overwhelming • Current online feedback from games is not reliable • Teacher want to see whole class stats • Problems the whole class are missing Built based on feedback
•MultiMouse (~2006) –Allowing computer to recognize different users •Metamouse (~2009) –Legacy computer programs •Mouse Mischief (~2010) –add-in for Microsoft PowerPoint 2007, 2010 –Simple short-term score page •“One Mouse per Child” Related Work
•Student Response System –“Clicker” price –Increase engagement and motivation –Presenting data: Historical Report, Comparison Report –25.1% of teachers use response to adjust instruction (The Effect of SRS… 2007) Related Work
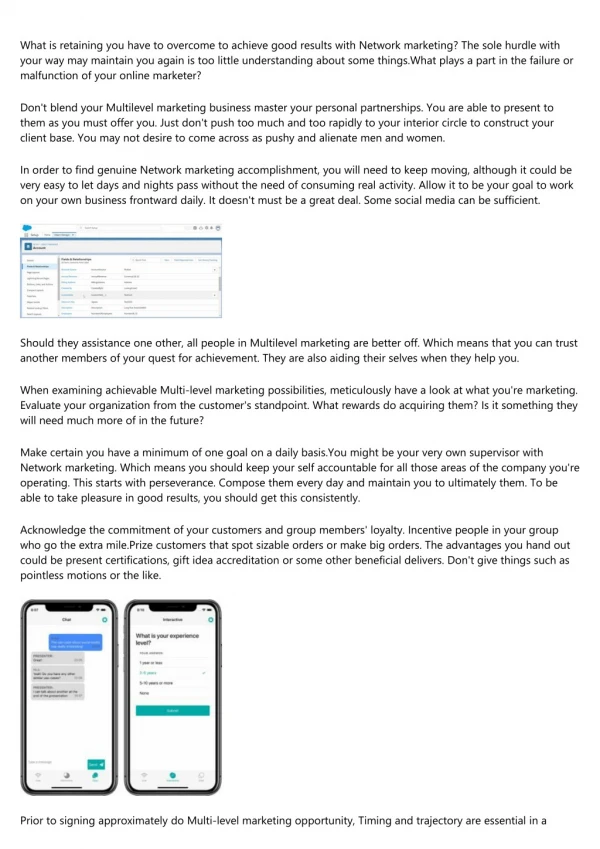
Web Application • Implementation • PHP, Javascript, & MySQL • Teacher interface • Teacher class list • Overall class statistics • Individual student view • Data conversion & DB management What we’ve accomplished so far
Teacher Interface • Class view • Add classes • View class list • View Individual Classes • Add Students • View Overall Stats
Teacher Interface • Overall Statistics • Class Percentages • Color coded • Student Table • Sortable • Student Graph • Color coded
Individual Student • Ability to add comments for himself/herself, the parent, or the student • Allows parents to gain an insight into how their child is doing, and allows teachers to communicate easily to the childs parents • Students can see what they could work on and what they are doing well Teacher Interface
Client Side Application uses SQLite, Web Application uses MySQL • PHP script converts SQLite file into MySQL tables that are automatically updated in our database • MySQL database can be created with a PHP script. • Allows for the database to be modular and easily deployed Data Conversion & DB management
Graphs Changes from original plan Now: Then:
Database Schema • New types of questions called for new schema • Much of the data was going unused • Exact problem not important • Type of problem important • More work done client side • Quicker, less complicated queries Changes from original plan
Rewriting multiLearn • Given buggy code • Crashed when certain pin numbers were typed • Poorly documented • ~5 lines of comments total • No documentation of Windows API usage • Compiling 32 vs 64 bit systems • Written for .NET 3.5 • Not supported by most computers • Used unreliable ADO database calls Changes from original plan
Client application • Implementation: • C# and SQLite • multiLearn • Error Handling • Degrades gracefully if computer is disconnected from internet • Automated data upload & download What we’ve accomplished so far
Architecture - Principles • Components should be as general (reusable) as possible • It should be easy to modify the program to add new types of questions • Export summary data instead of detailed data for every question • We’ve reduced the number of SQL rows to merge as well as the complexity of server-side queries • Documentation is not optional! Arhitecture - Principles
What we wanted • Client Application • Curriculum assessment tool • Data stored in SQLite database • Automated data upload • Web Application • Displays statistics • Accepts upload of usage data • Allows teachers to customize what kinds of questions are asked • Makes it easy to deploy these customizations to many classroom computers instantly Architecture - The Big Picture
About that rewrite: • More coding than expected • But worthwhile because we could customize every aspect of the application • Added games • Exporting of summary data • Automatic uploading/downloading of user data • Control over what questions are selected • Previously done by AI
Parent and Student access • Refining the interface • Additional graphs & charts • State/National Standards What’s Left - Server Side
Support for proxies • Many schools use these to implement content filtering • Add additional types of questions • Add additional teacher customization • Teacher customizable parent/student views • Ensure it is fun for students What’s Left - Client Side
Additional functionality (Week 9) • Parent/student login • Use of MultiSpell data • Printing • Paper/poster (Week 10) Timeline for remainder of quarter