Download
1 / 44
440 likes | 674 Views
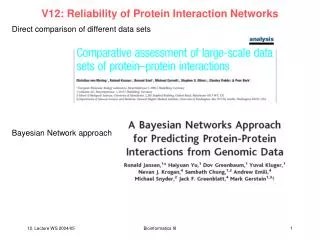
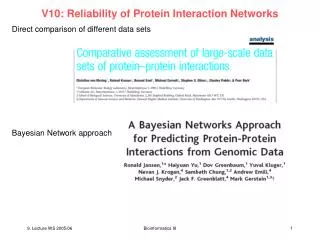
Towards uncovering dynamics of protein interaction networks. Teresa Przytycka NIH / NLM / NCBI. Investigating protein-protein interaction networks. Image by Gary Bader (Memorial Sloan-Kettering Cancer Center). Functional Modules and Functional Groups.

E N D
Towards uncovering dynamics of protein interaction networks Teresa Przytycka NIH / NLM / NCBI
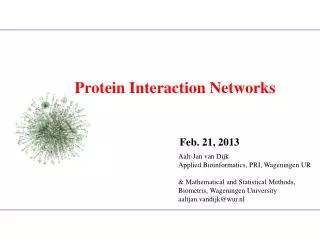
Investigating protein-protein interaction networks Image by Gary Bader (Memorial Sloan-Kettering Cancer Center). DIMACS, May 2006
Functional Modules and Functional Groups • Functional Module:Group of genes or their products in a metabolic or signaling pathway, which are related by one or more genetic or cellular interactions and whose members have more relations among themselves than with members of other modules (Tornow et al. 2003) • Functional Group: protein complex (alternatively a group of pairwise interacting proteins) or a set of alternative variants of such a complex. • Functional group is part of functional module DIMACS, May 2006
Challenge Within a subnetwork (functional module) assummed to contain molecules involved in a dynamic process (like signaling pathway) , identify functional groups and partial order of their formation DIMACS, May 2006
Computational Detection of Protein Complexes • Spirin & Mirny 2003, • Rives & Galitski 2003 • Bader et al. 2003 • Bu et al. 2003 • … a large number of other methods Common theme : Identifying densely connected subgraphs. DIMACS, May 2006
Protein interactions are not static • Two levels of interaction dynamics: • Interactions depending on phase in the cell cycle • Signaling DIMACS, May 2006
Signaling pathways EGF signaling pathway from Science’s STKE webpage DIMACS, May 2006
Previous work on detection of Signaling Pathways via Path Finding Algorithms Steffen et al. 2002; Scott et al. 2005 IDEA: • The signal travels from a receptor protein to a transcription factor (we may know from which receptor to which transcription factor). • Enumerate simple paths (up to same length, say 8, from receptor(s) to transcription factor(s) • Nodes that belong to many paths are more likely to be true elements of signaling pathway. DIMACS, May 2006
Figure from Scott et al. • Best path • Sum of “good” paths This picture is missing proteins complexes DIMACS, May 2006
Activation of the pathway is initiated by the binding of extracellular pheromone to the receptor Pheromone signaling pathway which in turn catalyzes theexchange of GDP for GTP on its its cognate G protein alpha subunit Ga. G b is freed to activate the downstream MAPK cascade receptor a g STE11 b STE7 STE20 STE11 FUS3 STE 5 STE7 or FUS3 KSS1 DIG2 DIG1 STE12 DIMACS, May 2006
Overlaps between Functional Groups For an illustrationfunctional groups= maximal cliques DIMACS, May 2006
Overlaps between Functional Groups For an illustration functional groups = maximal cliques DIMACS, May 2006
Overlaps between Functional Groups For an illustrationfunctional groups = maximal cliques DIMACS, May 2006
Overlaps between Functional Groups For an illustrationfunctional groups = maximal cliques DIMACS, May 2006
Overlaps between Functional Groups For an illustrationfunctional groups= maximal cliques DIMACS, May 2006
Overlaps between Functional Groups For an illustrationfunctional groups= maximal cliques DIMACS, May 2006
Overlaps between Functional Groups For an illustrationfunctional groups= maximal cliques DIMACS, May 2006
Overlaps between Functional Groups For an illustration functional groups= maximal cliques DIMACS, May 2006
Overlaps between Functional Groups For an illustrationfunctional groups= maximal cliques DIMACS, May 2006
Overlaps between Functional Groups For an illustrationfunctional groups= maximal cliques DIMACS, May 2006
First line of attack Overlap graph: Nodes= functional groups Edges= overlaps between them DIMACS, May 2006
First line of attack Overlap graph: Nodes= functional groups Edges= overlaps between them DIMACS, May 2006
First line of attack Overlap graph: Nodes= functional groups Edges= overlaps between them DIMACS, May 2006
First line of attack Overlap graph: Nodes= functional groups Edges= overlaps between them DIMACS, May 2006
First line of attack Overlap graph: Nodes= functional groups Edges= overlaps between them DIMACS, May 2006
First line of attack Overlap graph: Nodes= functional groups Edges= overlaps between them Misleading ! DIMACS, May 2006
Clique tree • Each tree node is a clique • For every protein, the cliques • that contain this protein form a connected subtree DIMACS, May 2006
Key properties of a clique tree We can trace each protein as it enters/ leaves each complex (functional group) Can such a tree always be constructed? DIMACS, May 2006
Clique trees can be constructed only for chordal graphs Chord = an edge connecting two non-consecutive nodes of a cycle Chordal graph – every cycle of length at least four has a chord. With these two edges the graph isnot chordal hole DIMACS, May 2006
Is protein interaction network chordal? • Not really • Consider smaller subnetworks like functional modules • Is such subnetwork chordal? • Not necessarily but if it is not it is typically chordal or close to it! • Furthermore, the places where they violates chordality tend to be of interest. DIMACS, May 2006
Add special “OR” edges Pheromone pathway from high throughput data; assembled by Spirin et al. 2004 Square 1: MKK1, MKK2 are experimentally confirmed to be redundant I Square 2: STE11 and STE7 – missing interaction Square 3: FUS3 and KSS1 – similar roles (replaceable but not redundant) DIMACS, May 2006
Original Graph, G Graph modification Modified Graph, G* Is the modified graph chordal? 5 6 1. Add edges between nodes with identical set of neighbors 2. Eliminate squares (4-cycles) (if any) by adding a (restricted) set of “fill in” edges connecting nodes with similar set of neighbors 5 6 7 S T O P 7 No 1 1 10 8 8 10 3 2 3 9 2 9 4 4 Yes 1. Compute perfect elimination order (PEO) 2. Use PEO to find maximal cliques and compute clique tree Tree of Complexes Maximal Clique Tree of G* 5, 6, 8 (1, 2), 8, 9 6, 10 (1, 2, 5, 8 (1,2),(3,4) 5, 7, 8 5 Protein Maximal clique 1 2 (5v8) v v 1 8 2 Fill-in edge
A B V A (A B C) v (D E) B B A A (B v C) V V V A A C B V D E C B Representing a functional group by a Boolean expression A v B DIMACS, May 2006
Cographs = graphs which can be represented by Boolean expressions Not all graphs can be represented by Boolean expression P4 DIMACS, May 2006
FUS3 STE11 STE 5 STE7 KSS1 STE5 STE11 STE7 (FUS v KSS1) v v v Example STE11 STE7 STE11 FUS3 STE 5 STE7 or FUS3 KSS1 DIMACS, May 2006
F A B C D E activation G = MKK1 v MKK2 = SPH1 = SPA2 = STE11 = STE5 = STE7 = FUS3 = HSCB2 = KSS1 = BUD6 = DIG1 DIG2 = MPT5 receptor G-protein a g STE11 b FUNCTIONAL GROUPS STE7 A = HSCB2 BUD6 STE11 C = (SPH1 v SPA2) (STE11 v STE7) E = STE5 (STE11 v STE7) (FUS3 v KSS1) G = (FUS3 v KSS1) MPT5 B = BUD6 (SPH1 v SPA2) STE11 D = SPH1 (STE11 v STE7) FUS3 F = (FUS3 v KSS1) DIG1 DIG2 H = (MKK1 v MKK2) (SPH1 v SPA2) STE20 STE11 FUS3 STE 5 STE7 or FUS3 KSS1 FAR 1 DIG2 DIG1 STE12 Cdc28 H
NF-κB resides in the cytosol bound to an inhibitor IκB. NF-κB Pathway Binding of ligand to the receptor triggers signaling cascade In particular phosphorylation of IκB IκB then becomes ubiquinated and destroyed by proteasomes. This liberates NF-κB so that it is now free to move into the nucleus where it acts as a transcription factor DIMACS, May 2006
D A B C NIK activation E = NIK = p100 = NFkB, p105 = IKKa = IKKb = IKKc = IkBa, IkBb = IkBe = Col-Tpl2 repressors activating complex Based on network assembled by: Bouwmeester, et al.: (all paths of length at most 2 from NIK to NF-kB are included) FUNCTIONAL GROUPS
Transcription complex Network from Jansen et al DIMACS, May 2006
Summary • We proposed a new method delineating functional groups and representing their overlaps • Each functional group is represented as a Boolean expression • If functional groups represent dynamically changing protein associations, the method can suggest a possible order of these dynamic changes • For static functional groups it provides compact tree representation of overlaps between such groups • Can be used for predicting protein-protein interactions and putative associations and pathways • To achieve our goal we used existing results from chordal graph theory and cograph theory but we also contributed new graph-theoretical results. DIMACS, May 2006
Applications • Testing for consistency • Generating hypothesis • “OR” edges – alternative/possible missing interactions. It is interesting to identify them and test which (if any) of the two possibilities holds • Question: Can we learn to distinguish “or” resulting from missing interaction and “or” indicating a variant of a complex. DIMACS, May 2006
Future work • So far we used methods developed by other groups to delineate functional modules and analyzed them. We are working on a new method which would work best with our technique. • No dense graph requirement • Our modules will include paths analogous to Scott et al. • Considering possible ways of dealing with long cycles. • Since fill-in process is not necessarily unique consider methods of exposing simultaneously possible variants. • Add other information, e.g., co-expression in conjunction with our tree of complexes. DIMACS, May 2006
References • Proceedings of the First RECOMB Satellite Meeting on Systems Biology. • Decomposition of overlapping protein complexes: A graph theoretical method for analyzing static and dynamic protein associations Elena Zotenko, Katia S Guimaraes, Raja Jothi, Teresa M PrzytyckaAlgorithms for Molecular Biology 2006, 1:7 (26 April 2006) DIMACS, May 2006
Thanks • Funding: NIH intramural program, NLM • Przytycka’s lab members: Protein Complexes Protein structure: comparison and classification Orthology clustering, Co-evolution Analysis of protein interaction networks Elena Zotenko DIMACS, May 2006 Raja Jothi