1 / 10

Equitable Data Management

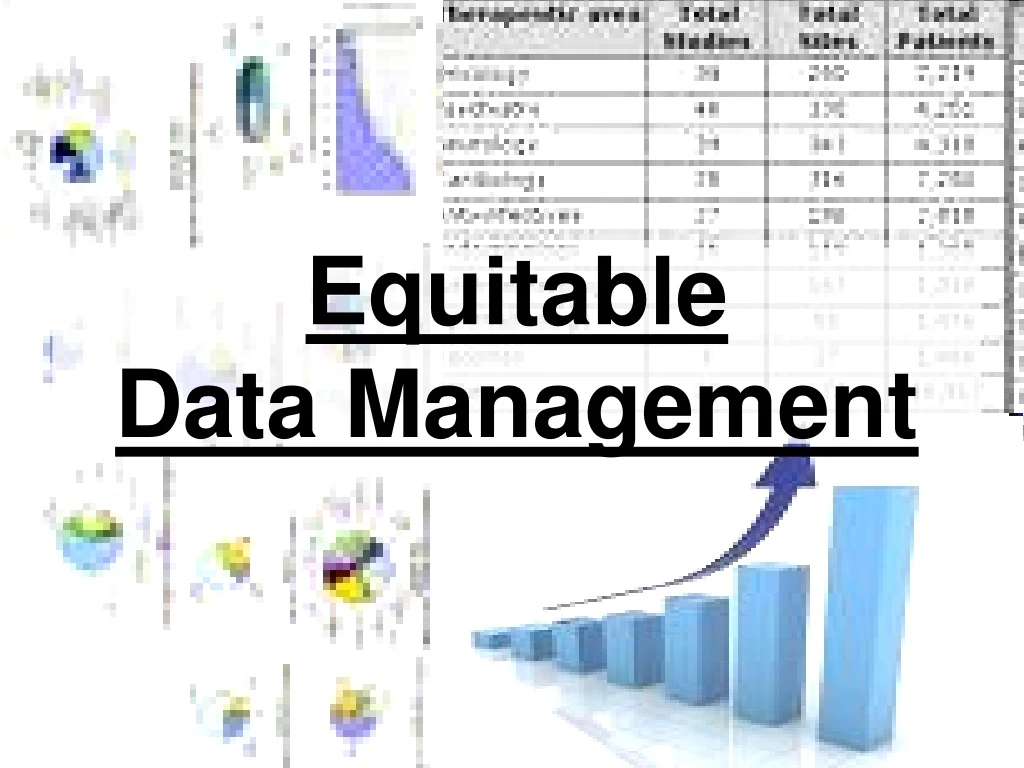
Explore the correlation between recreational spending and social issues' needs with a bar graph. Find insights on how to spend wisely and promote equitable data management.

paulettep
Download Presentation

Equitable Data Management

An Image/Link below is provided (as is) to download presentation Download Policy: Content on the Website is provided to you AS IS for your information and personal use and may not be sold / licensed / shared on other websites without getting consent from its author. Content is provided to you AS IS for your information and personal use only. Download presentation by click this link. While downloading, if for some reason you are not able to download a presentation, the publisher may have deleted the file from their server. During download, if you can't get a presentation, the file might be deleted by the publisher.

E N D

Presentation Transcript


  1. Equitable Data Management

  2. If you were given 50 dollars, what activities would you do or what would you buy?

  3. Activities

  4. Recreational Spending 25 billion 18 billion 15 billion 17 billion 14 billion 11 billion

  5. Total needed: $108,000,000,000

  6. Bar Graph of Recreational Spending and Social Issues’ Needs

  7. Bar graph of Recreational and Military Spending and Social Issues’ Needs

  8. Spend Well!!

More Related