Download
1 / 27
270 likes | 440 Views
Trip Generation for Street and Highways. Lecture 14 CE 4720 Norman Garrick. Trip Generation Calculations for Street and Highway Construction. Storrs Center. Storrs Center Google Earth The Site. Wetlands. Forest Reserve. Storrs Center Google Earth The Site Constraints.

E N D
Trip Generation for Street and Highways Lecture 14 CE 4720 Norman Garrick
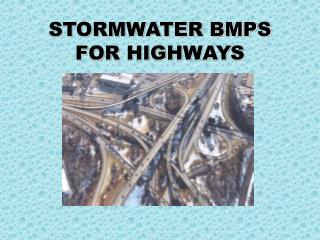
Trip Generation Calculations forStreet and Highway Construction
Storrs Center Norman W. Garrick
Storrs Center Google Earth The Site Norman W. Garrick
Wetlands Forest Reserve Storrs Center Google Earth The Site Constraints Norman W. Garrick
Storrs Center Google Earth The Site Built Area Norman W. Garrick
Storrs Center Norman W. Garrick
Storrs Center Model Norman W. Garrick
Storrs Center Model Village Road Norman W. Garrick
Storrs Center Google Earth Norman W. Garrick
Storrs Center 195 Problem Norman W. Garrick
Storrs Center Importance of the Network Norman W. Garrick
ITE Trip Generation Manual Proposed size of project Using TG Manual without Correction Estimated number of trip ends = 24,600 Norman W. Garrick
Using TG Manual with Correction for Mixed Use Estimated number of trip ends = 15,900 It is very important to remember that this total includes walking, biking and transit trips Not just car trips Norman W. Garrick
360 State, New Haven trip Generation over predict trips The 360 State Street was estimated to produce 674 PM peak hour vehicle trips Requiring the construction of 500 parking spaces Live monitoring shows only 116 trips (17% of what was predicted) - Mixed Use Trip Generation Model (New Haven and SCRCOG)
LOS, Volume CapacitySample Calculation A two lane urban street has an ADT of 20,000 vehicles per day. Estimate what fraction of the year this street will operate at i) LOS E, ii) LOS D. Do this calculation for directional splits of 50% and 60%. The hourly volume distribution and the design hour service volumes are given on the following sheets.
Traffic Distribution Hour volume as % of ADT Number of Hours with traffic great than shown
Design Hour Service Volume Urban Streets with Frequent Signal Controlled Intersections Source: http://www.dot.state.fl.us/planning/systems/sm/los/pdfs/lostables.pdf Assumptions: > 4.5 Signalized intersection, 1.5 % heavy traffic, 12 % left turn, 12 % right turn
Design Hour Service Volume Source: AASHTO 1990
LOS, Volume CapacityOcean Springs – Biloxi Bridge Estimate the level of service for the Ocean Springs – Biloxi Bridge.