Download

1 / 20
210 likes | 227 Views
Explore the use of image analysis in developing benchmarking datasets for variable-density flow scenarios. Learn about components of image analysis, benchmarking experiments, numerical modeling, challenges, and alternate approaches. Discover examples of rising and sinking plume experiments, laboratory setups, and heterogeneity generation techniques in this innovative study.

E N D
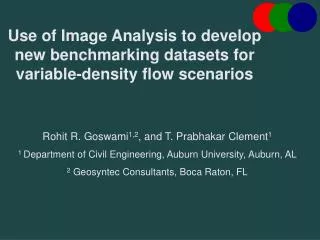
Use of Image Analysis to develop new benchmarking datasets for variable-density flow scenarios Rohit R. Goswami1,2, and T. Prabhakar Clement1 1 Department of Civil Engineering, Auburn University, Auburn, AL 2Geosyntec Consultants, Boca Raton, FL
Outline • Components of Image Analysis (IA) procedure • Overview of IA • Benchmarking experiments • Two experiments- rising plume, sinking plume • Numerical modeling • Challenges • Alternate approaches
Image Analysis- Background • Goswami & Clement (2007)- Laboratory-scale investigation of saltwater intrusion dynamics- Water Resources Research (43) Advancing Saltwater Wedge 5 mins 15 mins 55 mins
Components of IA • Calibration Relationship: fluid property v/s image property • Calibration data- experimentally obtained • Regression analysis- selecting relationship • Estimation of concentration levels 0.0 0.5 1.0 2.0 3.0 4.0
Benchmarking • Popular benchmarks • Henry problem- Henry (1964), Simpson & Clement (2004) • Elder problem- Elder (1967), Voss & Souza (1987) • Recent benchmarks- stable case • Oswald & Kinzelbach (2004), Goswami & Clement (2007) • Unstable case • Salt lake problem • Instabilities • Concentration data ? • Proposed exercise • IA to obtain concentration data • Testing the numerical approach
Flow Tank Lighting CCD Camera Translucent Sheet Variable-density Experiments • Laboratory Setup • 6 MP CCD Camera • CFL bulbs • LTM • Porous media • Homogeneous packing • Image analysis process • Two experiments- rising plume, sinking plume LTM
Variable-density Experiments • Example flow-tank setup
Physical Model- Rising Plume 0 min 3 min 6 min 8 min
Physical Model- Sinking Plume 0 min 2 min 5 min
z x Conceptualization- Rising Plume p=0 p=0 Porous Media 180 mm 153 mm injection point 114 mm 225 mm
z x Conceptualization- Sinking Plume constant h 174 mm constant h 178 mm injection point 54 mm Porous Media 145 mm 225 mm
Numerical Modeling • Generation of instabilities- two approaches • Use of particle-tracking methods (MOC) with low dispersivity values • Use small scale heterogeneities • Which approach is appropriate and why? • We will explore both approaches using the variable-density model SEAWAT
Heterogeneity Generation Flow Tank TUBA MATLAB 1% variability
Heterogeneity Results 0 min 1.0% Variability 3 min 0 min 2 min 5 min 6 min 8 min 1% Variability
How Much Heterogeneity? 0 min 3 min 6 min 8 min 0.1% Variability 10% Variability 1.0% Variability
Summary • Benchmarking datasets • We propose to use a combination of two unstable problems involving a sinking and a rising plume • They offer a unique combination – one with unstable fingers and one without fingers • Unstable benchmark problems can be simulated using two approaches – which is appropriate? • MOC/TVD with low dispersivity values • Heterogeneities • Heterogeneity approach appears to be more appropriate • How much heterogeneity to use is an open question
Acknowledgements • Mr. Bharath Ambale, PhD Candidate, Department of Electrical Engineering, Auburn University • Dr. Elena Abarca, Fulbright Fellow, MIT, formerly at Auburn University • Mrs. Linzy Brakefield, USGS, formerly at Auburn University • Department of Civil Engineering, Auburn University, AL • Geosyntec Consultants, Boca Raton, FL