Download
1 / 64
640 likes | 654 Views
This study by Daniel Rosenfeld explores the effects of cloud cover and albedo on marine boundary layer clouds, with an emphasis on the radiative forcing and cloud brightening phenomena. The research analyzes various components of radiative forcing related to aerosol-cloud interactions, cloud water path, and cloud cover effect, highlighting the global coverage of these perturbations and their net effect. The findings reveal insights into the muted aerosol-cloud interaction in deep clouds and the predominance of the albedo effect in global climate models.

E N D
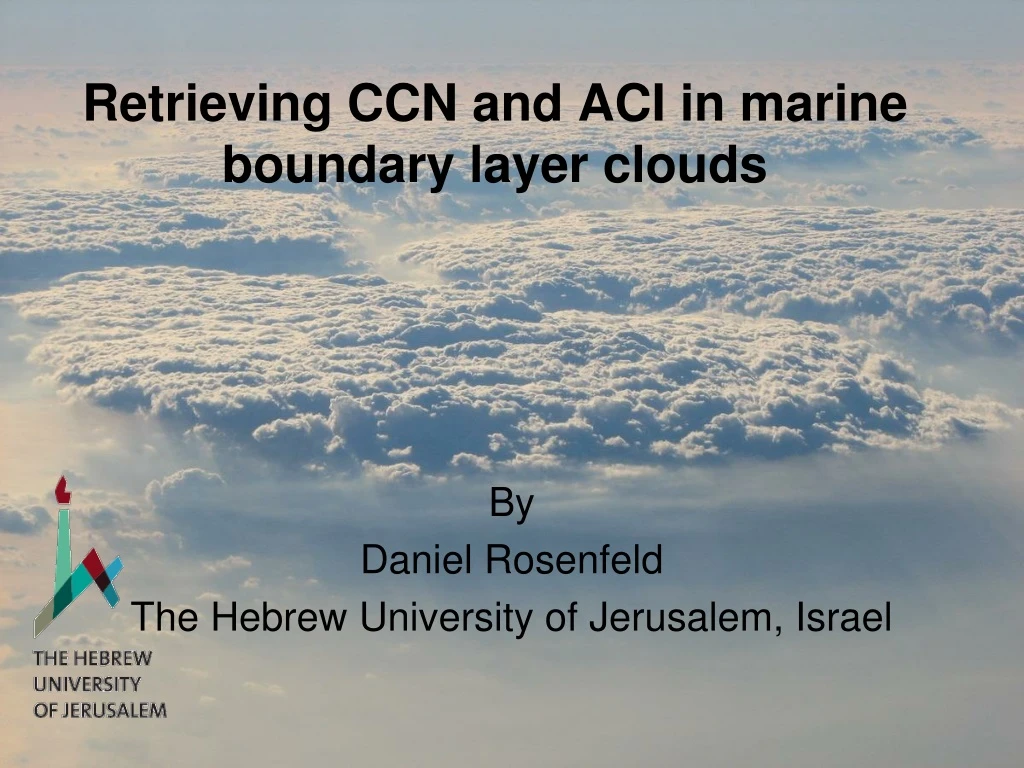
Retrieving CCN and ACI in marine boundary layer clouds By Daniel Rosenfeld The Hebrew University of Jerusalem, Israel
LWP & Cf effects?????? Mainly the albedo effect Effects from deep clouds? IPCC-AR5 Fig 8.15
Ship Track Formation 3. Cloud Cover Effect 2. Liquid Water Path effect 1. Cloud Brightening (Albedo) Effect N ~ 40 cm-3 W ~ 0.30 g m-3 re ~ 11.2 µm N ~ 100 cm-3 W ~ 0.75 g m-3 re ~ 10.5 µm
40 N 140 W 135 W 35 N Rosenfeld et al. Science 2019 MODIS, 26 June 2003, 19:40 UT
The components of the radiative forcing due to closing open MSC, totaling -110 Wm-2 Cloud brightening for a given cloud water path (Twomey) 26 ± 7 % Scene brightening due to increased Cloud Cover 42 ± 9 % -29 Wm -2 -46 Wm -2 -35 Wm -2 Cloud brightening due to increased Cloud Water Path 32 ± 11 % Goren and Rosenfeld, Atmos. Res., 2013
-30 to -110 wm-2 Goren and Rosenfeld, Atmos. Res., 2013
+30 wm-2 From Cb anvils over DOE/ARM SGP Yan et al., ACP 2014 Using 10-Year ground based measurements
+30 wm-2 From Cb anvils over DOE/ARM SGP Yan et al., ACP 2014 Using 10-Year ground based measurements -30 to -110 wm-2 Goren and Rosenfeld, Atmos. Res., 2013 What is the global coverage of these perturbations and the net effect?
BUT! GCMs have no ACI for deep clouds Muted ACI for LWP and cloud cover effect GCMs have mainly the albedo effect
Clouds Nd90% Re90% LWP Cf CRE t Meteor. LTS CGT Hb CTRC Wb Dq
Focusing at the convective cores • Minimal bias due to partial pixel filling • Most adiabatic • Best representing surface CCN 50% 10% Zhu et al., 2018
Nd, Cloud drop concentrations at brightest 10% of the clouds cm-3 LTS, Low Tropospheric Stability, q700-q1000 [°K]
Suppressed rain Rain
Re Calculated by Chongching Fan
Re Calculated by Chongching Fan
JQ Suppressed rain Rain Nd and CGT assume adiabatic cores. The adiabatic fraction (AF) is likely to be smaller with more rain, i.e., with lower Nd. -Nd-AFunder-estimated Nd +slopes +Susceptibility. This is compensated by a respective underestimate of CGT.
Stable Stratus LTS>18K Transition Stratocumulus 18 ≥ LTS≥14K Unstable Cumulus LTS<14K Cf Nd [cm-3] • Nd determines cloud fraction and LWP, mainly by its control of precipitation that breakup the cloud cover. • Similar qualitative behavior from stratus to cumulus • Less sensitivity to cumulus, because it cannot have full cloud cover.
+CGT+Cf +Nd +Cf • Meteorology determines Cloud Geometrical Thickness (CGT) whereas CCN determines Nd. • Nd determines cloud fraction (Cf) and LWP, mainly by its control of precipitation that breakup the cloud cover. • Nd (CCN) determines 3/4 of the variability in CRE for a given CGT.
Cf LTS<14 LTS>18 18>LTS>14 Nd LWP Nd ~95% of the variability in CRE is explained by Nd, CGT, LTS and CTRC CRE Nd
Nd explains 37-45% of the variability in CRE CGT explains similar amount of variability
For a given CCN, Nd increases with Wb0.5 To neutralize the effect of Wb and get Nd that corresponds to CCN, we use Nd/Wb0.5
Nd explains ~3/4 of the variability in CRE for the same CGT, i.e., meteorology. Nd
Doubling Nd Doubling CRE Cloud radiative effect [W m-2] Drop number concentration [cm-3]
So why is ACI so low in GCMs? ????????????????????? Mainly the albedo effect IPCC-AR5 Fig 8.15
So why is ACI so low in GCMs? • Drop concentrations not retrieved in broken clouds, where most needed. • AOD blind to low CCN, where most needed. • Observations reversed cause and effect. • Radiative convective equilibrium (RCE) is inherently buffered, RCE is rarely reached. • Tuned up aerosol suppression of rain for decreasing cooling. • Misinterpretation of volcanic perturbations.
So why is ACI so low in GCMs? • Drop concentrations not retrieved in broken clouds, where most needed. • AOD blind to low CCN, where most needed. • Observations reversed cause and effect. • Radiative convective equilibrium (RCE) is inherently buffered, RCE is rarely reached. • Tuned up aerosol suppression of rain for decreasing cooling. • Misinterpretation of volcanic perturbations.
But most of the ACI is mediated by breaking the cloud cover with dearth of aerosols Global mean droplet concentration from MODIS using Level-3 product For liquid clouds with >80% 1x1o cloud fraction For liquid clouds with >80% 1x1o cloud fraction Rob Wood, U. Washington
Focusing at the convective cores • Minimal bias due to partial pixel filling • Most adiabatic • Best representing surface CCN 50% 10% Zhu et al., 2018
Nd is determined by both CCN and Wb Chen et al., GRL 2016:New understanding and quantification of the regime dependence of aerosol‐cloud interaction for studying aerosol indirect effects • Nd<100 Aerosol limited Wb less important • Still, we can retrieved Wb and get CCN even more accurately Geophysical Research LettersVolume 43, Issue 4, pages 1780-1787, 29 FEB 2016 DOI: 10.1002/2016GL067683http://onlinelibrary.wiley.com/doi/10.1002/2016GL067683/full#grl54054-fig-0001
So why is ACI so low in GCMs? • Drop concentrations not retrieved in broken clouds, where most needed. • AOD blind to low CCN, where most needed. • Observations reversed cause and effect. • Radiative convective equilibrium (RCE) is inherently buffered, RCE is rarely reached. • Tuned up aerosol suppression of rain for decreasing cooling. • Misinterpretation of volcanic perturbations.
Most of the oceans have Nd < 100 cm-3 • Too low CCN for measurable AOD Global mean droplet concentration from MODIS using Level-3 product For liquid clouds with >80% 1x1o cloud fraction For liquid clouds with >80% 1x1o cloud fraction Rob Wood, U. Washington
No AI No signal MODIS Aerosol Index MODIS Aerosol Optical Depth Can’t calculate AI for AOD<~0.1
2013 Calculated effect No LWP & Cf effects AOD Aerosol forcing depends strongly on the reference background. Limiting the sensitivity would limit the detectable forcing
All Cf Aerosol Optical Depth Nd90 [cm-3] LWP is positive for low Nd (rainout) and negative for high Nd (drop evaporation) for all Cf, but overall susceptibility is positive.
l = ∂ln(LWP)/ ∂ln(Nd) MODIS Aerosol Optical Depth Cloud Drop Concentrations LWP effect is detectable at a reduced magnitude when using AOD (compared to Nd) for all Cf, when classifying by CGT.
So why is ACI so low in GCMs? • Drop concentrations not retrieved in broken clouds, where most needed. • AOD blind to low CCN, where most needed. • Observations reversed cause and effect. • Radiative convective equilibrium (RCE) is inherently buffered, RCE is rarely reached. • Tuned up aerosol suppression of rain for decreasing cooling. • Misinterpretation of volcanic perturbations.
Sato et al: “Our analyses reveal that the decrease in LWP originates from the response of evaporation and condensation processes to aerosol perturbations”. l = ∂ln(LWP)/ ∂ln(Nd) Really? GCRM MODIS l = ∂ln(LWP)/ ∂ln(Nd)
l = ∂ln(LWP)/ ∂ln(Nd) A A B B l Is positive for less raining clouds • Using our data replicated the negative l and its latitudinal dependence. • How can these contradicting results co-exist? • Having reproduced both we can explain it.
CGT increases with decreasing Nd +CGT +LWP +Rain +Aerosol scavenging -Nd +CGT +LWP +Rain +Aerosol scavenging -Nd l = ∂ln(LWP)/ ∂ln(Nd) <0 l >0 for less raining clouds Extremely low Nd suppresses CGT due to high S (Koren et al., Science 2014)
The negative lshows the effects of clouds on aerosols, and NOT the effect of aerosols on clouds! This shows the effect of aerosols on clouds!
A conclusion In analogy to the aerosol cloud albedo (Twomey) effect being defined only for a fixed LWP --- The LWP and Cf effects must be defined only for a fixed CGT. That has not been done previously !
So why is ACI so low in GCMs? • Drop concentrations not retrieved in broken clouds, where most needed. • AOD blind to low CCN, where most needed. • Observations reversed cause and effect. • Radiative convective equilibrium (RCE) is inherently buffered, RCE is rarely reached. • Tuned up aerosol suppression of rain for decreasing cooling. • Misinterpretation of volcanic perturbations.
2015 RCE simulation results have been used only after reaching equilibrium fully buffered.
2015 However, cloud systems rarely live in the same environment more than 12 hours (Dagan et al., 2018), thus NOT buffered.