Download
1 / 17
170 likes | 274 Views
Remote sensing of wind-borne pressures during hurricanes with a network of wireless sensors. Presenting: Gabriel Lapilli Chelakara Subramanian, Jean-Paul Pinelli, Ivica Kostanic , Gabriel Lapilli, Jiten Chandiramani, Connor Poske Florida Institute of Technology 2011. Scope.

E N D
Remote sensing of wind-borne pressures during hurricanes with a network of wireless sensors Presenting: Gabriel Lapilli Chelakara Subramanian, Jean-Paul Pinelli,IvicaKostanic, Gabriel Lapilli, Jiten Chandiramani, Connor Poske Florida Institute of Technology 2011
Scope • Purpose of the project • Description of the system itself • Data analyses and information that can be extracted • Summary
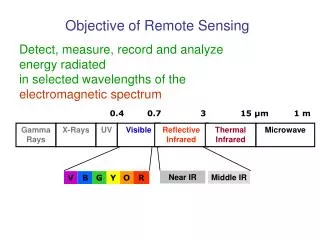
Importance of Full-Scale measurements • Full-Scale measurements must exist to provide: • A way of validating wind tunnel measurements, numerical simulations and any other predictions • Information to improve the models used • Particularly of interest: • Frequency pressure spectrum for structural analysis and turbulence modeling • Peak pressure measurement and prediction for code validation
System Overview Communication network
Hardware • Surface mount board • Built using liquid solder, stencil and baked in infrared oven • Pressure transducer: MP3H6115AC6U from Freescale Semiconductors • Temperature transducer: MCP9700AT-E/TT from Microchip Technologies • Xbee-Pro Transceiver • Direct USB firmware updates • Li-ion batteries • Charger circuit on board: 900mA current (complete charge time: 6 hours) • 48 MHz PIC18LF2553 (12 bit A/D converter) Li-Ion 6000 mAh 3.7V battery PIC processor Temperature Transducer Pressure Transducer Transceiver USB Port
Hardware • Expansion slot: • Possibility to mount almost any sensor with an adapter board • Used for anemometer (speed and direction) • Xbee-Pro Transceiver: • 2.4GHz Frequency • 15 channels • On-chip antenna • 35kbps throughput • Each transceiver has a unique ID • Talking order is self-negotiated Expansion Slot Antenna
Hardware • Same board, different setups: • Pressure and temperature sensor boards • Router • Anemometer board • Base unit • Custom plastic cases • Lightweight • No interference with radio signals (no need for external antenna on sensors) • Rubber molds
Hardware Router • Acts as a “bridge” • Increased range (higher gain omnidirectional antenna) • Connection is negotiated when units are turned on or when software is restarted • Sensors can talk either directly to base or through a router
Software Main screen: • Network tree display • Right-click menus • Change status of sensors (start-stop) • Hardware wireless reset of PIC (for frozen sensors) • Real-time graph • Real-time information
Software Data Logging: • Plain text comma-separated value files (.csv) • Can be opened in any text editor or spreadsheet software • Logging in 5-minutes chunks for data transmission to central server
System Performance Sample rate: Full system (30 sensors, with 3 routers and anemometer) runs smoothly at 30 samples/sec Total Packet Loss (full deployment) <1%
Behavior 5-day comparison with Paroscientific MET3A station (certified ±0.08mbar), part of the Suominet Network, located at Florida Institute of Technology’s campus • Accuracy Sample Size: 128 points of mean data + raw 10Hz data Mean data interpolated to 10Hz signal From hour 45 to hour 105: Standard deviation of means (all sensors) = 0.0404 mbar (Tends to zero as # Samples→infinity) • Precision Standard Deviation of samples (subtracted means): 0.3085 mbar This means that the system was capable of measuring signals with a total maximum error of ±0.61 mbar in a confidence level of 95.45%, an order of magnitude lower than the pressure differences measured during a hurricane. Heavy Thunderstorm
Advantages • Non-Intrusive: No need for wires, holes, special connections • Easily deployable: whole setup process takes less than 1 hour • Loss-safe: Data is transmitted on real time to central server, and also stored locally (in case communication fails) • Robustness: Communication with sensors is automatically renegotiated if signal is lost
Data Analysis a. Spectrum analysis: To determine which frequencies are pertinent to study for structural purposes. Currently observing over different averages and window sizes
Data Analysis b. Correlation analysis: To determine pressure effects variation, uniformity of the pressure readings and relationship between velocity and pressure (effect of gusts can be analyzed)
Summary System has proved to be reliable and robust Currently working on data analysis and post processing techniques Planning real storm deployment for coming season Test on IBHS full-scale wind tunnel in South Carolina scheduled for this Spring
This material is based upon work supported by the National Science Foundation under Grant No. 0625124, and by the Division of Emergency Management of the Florida Department of Community Affairs under Grant No. 10-RC-26-12-00-22-254. Any opinions, findings, and conclusions or recommendations expressed in this material are those of the authors and do not necessarily reflect the views of the National Science Foundation or the Florida Department of Community Affairs. ?