Download
1 / 18
200 likes | 234 Views
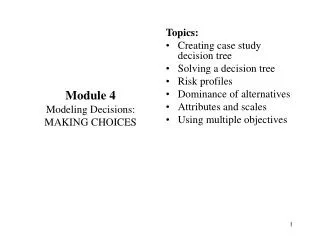
Decisions Involving Multiple Objectives: SMART. Objectives and Attributes. An objective = an indication of preferred direction of movement, i.e. ‘minimize’ or ‘maximize’ An attribute is used to measure performance in relation to an objective. An office location problem.

E N D
Decisions Involving Multiple Objectives: SMART
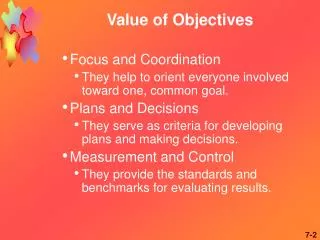
Objectives and Attributes • An objective = an indication of preferred direction of movement, i.e. ‘minimize’ or ‘maximize’ • An attribute is used to measure performance in relation to an objective
An office location problem Location of office Annual rent ($) Addison Square 30 000 Bilton Village 15 000 Carlisle Walk 5 000 Denver Street 12 000 Elton Street 30 000 Filton Village 15 000 Gorton Square 10 000
Main stages of SMART 1 Identify decision maker(s) 2 Identify alternative courses of action 3 Identify the relevant attributes 4 Assess the performance of the alternatives on each attribute 5 Determine a weight for each attribute 6 For each alternative, take a weighted average of the values assigned to that alternative 7 Make a provisional decision 8 Perform sensitivity analysis
Benefits Costs Turnover Working conditions Closeness Visibility Image to customers Size Comfort Car parking Rent Electricity Cleaning Value tree
Is the value tree an accurate and useful representation of the decision maker’s concerns? • Completeness • Operationality 3. Decomposability 4. Absence of redundancy 5. Minimum size
Costs associated with the seven offices Annual Annual Office Annual cleaning electricity Total rent ($) costs ($) costs ($) costs ($) Addison Square 30 000 3000 2000 35 000 Bilton Village 15 000 2000 800 17 800 Carlisle Walk 5 000 1000 700 6 700 Denver Street 12 000 1000 1100 14 100 Elton Street 30 000 2500 2300 34 800 Filton Village 15 000 1000 2600 18 600 Gorton Square 10 000 1100 900 12 000
Direct rating for ‘Office Image’ • Ranking from most preferred to least preferred. 1. Addison Square 2. Elton Street 3. Filton Village 4. Denver Street 5. Gorton Square 6. Bilton Village 7. Carlisle Walk
Closeness to customers Visibility Image Size Comfort Car parking 100 Best 80 Best 70 Best Best Best Best Worst 0 Worst Worst Worst Worst Worst Determining swing weights
For example... A swing from the worst ‘image’ to the best ‘image’ is considered to be 70% as important as a swing from the worst to the best location for ‘closeness to customers’ ...so ‘image’ is assigned a weight of 70.
Normalizing weights Normalized weights Attribute Original weights (rounded) Closeness to customers 100 32 Visibility 80 26 Image 70 23 Size 30 10 Comfort 20 6 Car-parking facilities 10 3 310 100
Calculating aggregate benefits for each location Addison Square Attribute Values Weight Value weight Closeness to customers 100 32 3200 Visibility 60 26 1560 Image 100 23 2300 Size 75 10 750 Comfort 0 6 0 Car-parking facilities 90 3 270 8080 so aggregate benefits = 8080/100 = 80.8
Table 3.2 - Values and weights for the office location problem ____________________________________________________________________ Attribute Weight Office A B C D E F G _____________________________________________________________________________________ Closeness 32 100 20 80 70 40 0 60 Visibility 26 60 80 70 50 60 0 100 Image 23 100 10 0 30 90 70 20 Size 10 75 30 0 55 100 0 50 Comfort 6 0 100 10 30 60 80 50 Car parking 3 90 30 100 90 70 0 80 Aggregate benefits 80.8 39.4 47.4 52.3 64.8 20.9 60.2 _____________________________________________________________________________________