Download
1 / 17
170 likes | 386 Views
Basics of Statistics. Data Frequency Dot plot Histogram Stem & Leaf Summary Statistics Shape Center Spread. Case study – data mining Using and interpreting the correct graphical display Mean, Median, Mode Std Deviation, IQR, Range Standard Score – z-score

E N D
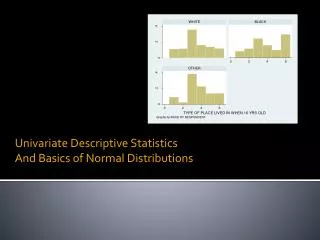
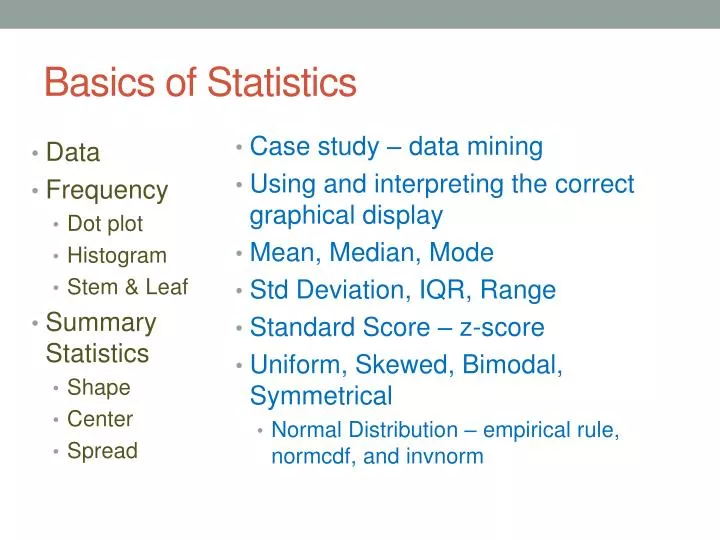
Basics of Statistics • Data • Frequency • Dot plot • Histogram • Stem & Leaf • Summary Statistics • Shape • Center • Spread • Case study – data mining • Using and interpreting the correct graphical display • Mean, Median, Mode • Std Deviation, IQR, Range • Standard Score – z-score • Uniform, Skewed, Bimodal, Symmetrical • Normal Distribution – empirical rule, normcdf, and invnorm
Regression and Correlation analysis • Scatterplots • Shape • Trend • Strength • Influential • Regression equation • Slope • Intercept • residuals • Using calculator to analyze bivariate data • Linear or non-linear • Positive, negative, none • Strong, moderate, weak • Outliers (in x or y or both) • Line of best fit (algebraic) vs. Least squares regression (standard scores) • Interpreting slope and y-intercept in the context of problem • Extrapolation and Interpolation
Regression and Correlation analysis • Scatterplots • Regression equation • Slope • Intercept • Residuals • Transformations • Using calculator to analyze bivariate data • Linear or non-linear • Using Log (or Ln) transformation • Re-expressing data • Patterns in Residual graphs
Regression and Correlation analysis • Correlation – r value • Proximity to least squares line • Coefficient of determination – r-squared value • How much of variation in y is explained by x • Estimating r-value on linear scale (between -1 and +1) • Calculating r-value using z-scores or calculator • Interpreting r-value in context • Calculating r-sq value (using computer data analysis) • Interpreting r-sq value in context
Sampling and Experiment Design • Random sampling techniques • SRS • Stratified • Cluster • Systematic • 2 stage cluster • Using random number generator • Table • Calculator • Dice / cards • “picking out of hate” • Being random gives a more representative sample to reduce the effects of bias (more variation!) • Convenience • Opinion • Size / Selection • Volunteer • Response / Questionaire
Experiment Design • Observation • Experiment • Units • Treatments • Factor levels • Control • Blocking • Replication • Response variable • Experiment template • Identification of parts • Benefits of designs • CRD • Blocks • Matched Pairs • Random assignment of treatments reduces the effects of bias (less variation!) • Response • Placebo effect • Lurking variables • Confounding variables