Download
1 / 10
100 likes | 230 Views
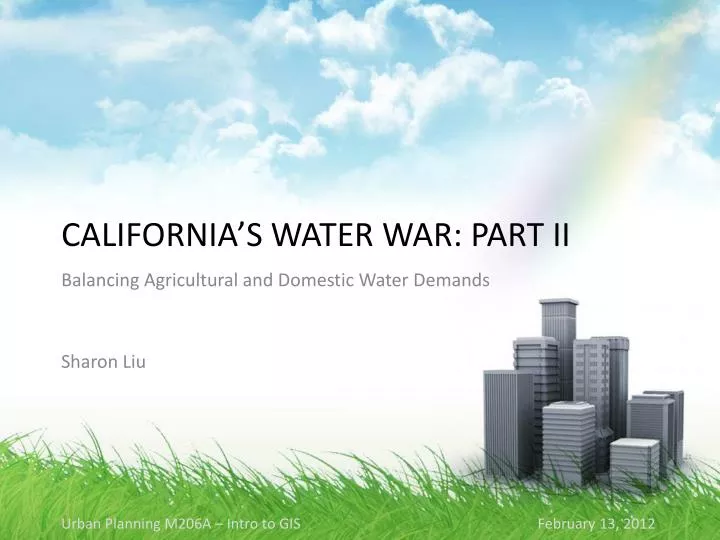
California’s Water WAR: Part II. Balancing Agricultural and Domestic Water Demands Sharon Liu. Urban Planning M206A – Intro to GIS February 13, 2012. Motivation. US Census Bureau estimates California’s population will grow 37% between 2000 and 2030 ↑ domestic water demands

E N D
California’s Water WAR: Part II Balancing Agricultural and Domestic Water Demands Sharon Liu • Urban Planning M206A – Intro to GISFebruary 13, 2012
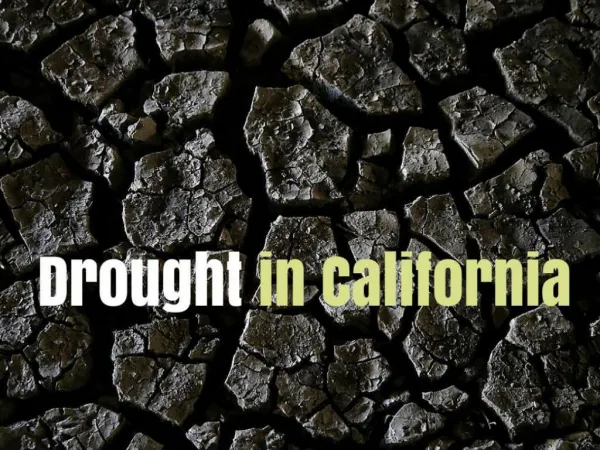
Motivation • US Census Bureau estimates California’s population will grow 37% between 2000 and 2030 • ↑ domestic water demands • ↑ crop production ↑ agricultural water demands • US Department of Agriculture estimated that California’s agriculture industry generated $15.5 billion in 2000 • California is #1 in agriculture THE PROBLEMFreshwater is a finite resource. • SOURCES: US Census Bureau (2000 State Interim Population Projections), US Department of Agriculture (2000 Crop Values)
CROP VALUE BY STATE • SKILLS: graduated symbols, aggregating attribute fields (Crop Value = Field/Misc. Crops + Fruits/Nuts + Commercial Vegetables) • SOURCES: UCLA Mapshare State and Country Boundaries, US Department of Agriculture (2000 Crop Values), 2000 US Census Bureau
Metrics for Evaluation • Domestic Water Demands (per capita water use) • Agricultural Water Demands(proxied by evapotranspiration) • #1 crop value ($) • #1 crop volume YEAR 2000(moderate La Niña -> dry weather) • SOURCES: Global ENSO SST Index (University of Washington)
What is Evapotranspiration? ET = Evaporation + (Plant) Transpiration Sufficient H20 ↑ crop growth (↑ ET) =↑ crop value($) Where does the H20 come from? • Native (rainfall, groundwater, etc) • Irrigation (imported water)
WEATHER Stations • 224 total stations • 102 stations with data for year 2000 Use CIMIS data to calculate ET (Currently, 141 active and 83 inactive) • SKILLS: inset map, custom shapefile creation (CIMIS station locations) • SOURCES: UCLA Mapshare County, State, and Country Boundaries, California Department of Water Resources (2000 Irrigated Crop Acres and Water Use), California Irrigation Management and Information System (station locations and period of record)
EVAPOTRANSPIRATION by County • SKILLS: creating indices (AW Efficiency = ETAW/AW), aggregating attribute fields (Applied Water = ΣAW for all 20 crop types), graduated symbols • SOURCES: UCLA Mapshare County, State, and Country Boundaries, California Department of Water Resources (2000 Irrigated Crop Acres and Water Use)
Significant Crop Types California is the #1 Alfalfa Producer in the US! California’s #1 Crop ($18.6 million in 2000) • SKILLS: graduated symbols • SOURCES: UCLA Mapshare County, State, and Country Boundaries, California Department of Water Resources (2000 Irrigated Crop Acres and Water Use)
Per Capita Water Use 2010 State Water Conservation Goal: 20% Reduction by 2020 • SKILLS: graduated symbols, creating indices (pcwu = public supply withdrawals / total population), attribute subset selection (top 20% counties) • SOURCES: UCLA Mapshare County, State, and Country Boundaries, California Department of Water Resources (2000 Irrigated Crop Acres and Water Use, 20x2020 Water Conservation Plan), US Geological Survey (2000 Estimated Water Use)
Next Steps • Account for population growth in domestic water demands • Focus on the top 2 crops and their impacts • Quantify the imbalance between agricultural and domestic water demands