Download
1 / 59
590 likes | 698 Views
Insight Improvement Impact ®. IDEA Student Ratings of Instruction. Loyola University of Chicago April 10-11, 2013. Steve Benton, PhD Senior Research Officer. I ndividual D evelopment E ducational A ssessment. Teaching Improvement. Faculty Evaluation Curriculum Review

E N D
Insight Improvement Impact® IDEA Student Ratings of Instruction Loyola University of Chicago April 10-11, 2013 Steve Benton, PhD Senior Research Officer
Individual Development Educational Assessment Teaching Improvement Faculty Evaluation Curriculum Review Program Assessment Accreditation
Insight Improvement Impact® A Non-Profit Organization • Kellogg Grant in 1975 • Separate Organization and Non-profit status 2001 • Mission To help colleges and universities as they seek to improve teaching, learning, and leadership
Plan for this Session • What makes IDEA unique • Good Conditions for the use of IDEA • Student Learning Model • Faculty Information Form • Interpreting Reports • Using Reports for Teaching Improvement Efforts • Questions and Answers
What is teaching effectiveness? Being Clear Being Prompt Being Organized Forming learning teams Relating course material to real life situations Requiring critical thinking Introducing stimulating ideas Inspiring students to set and achieve goals
Teaching Effectiveness Most Surveys How well do students rate their progress on the types of learning the instructor targeted? How well do the instructor’s methods resemble those of a “model” teacher?
What is teaching effectiveness? Philosophy of IDEA Primary indicant of Teaching Effectiveness = Facilitating Learning
What makes IDEA unique? • Focus on Student Learning • Focus on Instructor’s Purpose • Adjustments for Extraneous Influences • Validity and Reliability • Comparison Data • Flexibility
Conditions for Good Use • The instrument • Targets learning • Provides suggested action • steps for teaching improvement
Conditions for Good Use The Faculty • Trust the process • Value student feedback • Are motivated to make improvements
Conditions for Good Use • Campus Culture • Teaching excellence - high priority • Resources to improve - provided • Student ratings - appropriate weight
Conditions for Good Use The Evaluation Process • 30-50% of evaluation of teaching • 6-8 classes, more if small (<10) • Not over-interpreted (3-5performance categories)
Reflective Practice using Individual Reports Try new ideas Online, Paper Talk with colleagues What the reports say and what they mean IDEA resources that are keyed to reports
Student Learning Model Specific teaching behaviors are associated with certain types of student progress under certain circumstances. Teaching Behaviors Circumstances Student Learning
Student Learning Model: Diagnostic Form Teaching Behaviors Items 1-20 Student Learning Items 21-32 Summary Items: 40-42 Research Items: 44-47 Up to 20 extra items Circumstances Students: Items 36-39, 43 Course: Items 33-35
Student Learning Model: Short Form Summary Measures: Items 16-18 Experimental Questions: Items 14 20 Additional Questions Teaching Behaviors Student Learning Items 1-12 Circumstances Students: Items 13-15
Underlying Philosophy of IDEA Teaching effectiveness is determined primarily by students’ progress on the types of learning the instructor targets.
FIF: Selecting Objectives • 3-5 as “Essential” or “Important” • Is it a significant part of the course? • Do you do something specific to help students accomplish the objective? • Does the student’s progress on the objective influence his or her grade? Be true to your course.
Curriculum Review • Multi-section courses • Prerequisite-subsequent courses • Curriculum committee review
IDEAGen Ed Goals in the Curriculum IDEA Learning Objectives
IDEA Gen Ed Goals in the Curriculum IDEA Learning Objectives
Common Misconception #1 Students are expected to make significant progress on all 12 learning objectives in a given course.
Common Misconception #2 Effective instructors need to successfully employ all 20 teaching methods in a given course.
Common Misconception #3 The 20 teaching methods items should be used to make an overall judgment about teaching effectiveness. Faculty Evaluation
Used for research Best answered toward end of term Do NOT influence your results Course Description Items (FIF) Bottom of Page 1 Top of page 2
FIF Online Delivery • Reminders are delivered by email • Start/end dates are determined by Institution • Access is unlimited while available • Questions can be added: Likert or open- ended • Objectives can be copied
Student Survey Online Delivery • Surveys are delivered by Email and/or the URL is embedded in a course site • Blackboard Building Block is available • Reminders are sent by email • Start/end dates determined by Institution • Submission is confidential and restricted to one
Online Response Rates – Best Practices • Create value for feedback • Monitor and Communicate • Social Media • Twitter • Prepare Students • Talk to students • Put it in syllabus
Reflective Practice with IDEA IDEA Student Ratings of Instruction Reports
Diagnostic Report Overview • How did students rate their learning experience? What contextual factors impacted those ratings? How do my scores compare to: IDEA, discipline, and institution? What might I do to facilitate better learning for my students next time?
1. How did Students Rate their Learning? 1If you are comparing Progress on Relevant Objectives from one instructor to another, use the converted average.
4 Progress On Relevant Objectives 4.3 + 4.3 4.1 4.2 3.6 5
Summary Evaluation: Five-Point Scale 50% 25% 25%
Adjusted Scores • Student Work Habits (#43DF) • Student Motivation (#39DF) • Class Size (Enrollment, FIF) • Student Effort (multiple items) • Course Difficulty (multiple items)
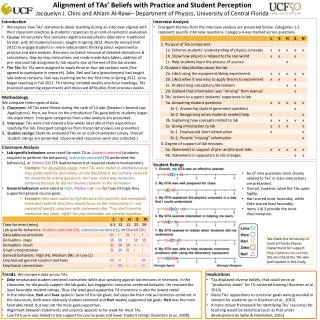
Work Habits (Item 43) Student Motivation (Item 39) High High Avg. Avg. Low Avg. Low High 4.48 4.38 4.28 4.13 4.04 High Avg. 4.38 4.29 4.14 3.96 3.76 Average 4.28 4.14 4.01 3.83 3.64 Low Avg. 4.15 4.05 3.88 3.70 3.51 Low 4.11 3.96 3.78 3.58 3.38 Impact of Extraneous Factors • Gaining Factual Knowledge – Average Progress Ratings Technical Report 12, page 40
Work Habits (Item 43) Student Motivation (Item 39) High High Avg. Avg. Low Avg. Low High 4.48 4.38 High Avg. 4.38 4.29 Average 4.01 Low Avg. 3.70 3.51 Low 3.58 3.38 Impact of Extraneous Factors • Gaining Factual Knowledge – Average Progress Ratings Technical Report 12, page 40
3. How do my scores compare to: IDEA, Discipline, Institution?
Comparisons (Norms): Converted Averages • Able to compare scores on the same scale T Scores • Average = 50 • Standard Deviation = 10 • They are not percentiles or percentages
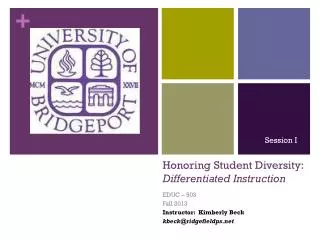
Comparison Scores Distribution Gray Area 40% Similar 20% 20% 10% Much Higher 10% Much Lower Lower Higher