Download
1 / 20
200 likes | 427 Views
Sources of Synoptic CO2 Variability in North America. Nick Parazoo Atmospheric Science Colorado State University ChEAS, June 5, 2006. Acknowledgments: Scott Denning, Ken Davis, Arlyn Andrews, Doug Worthy, Larry Flanagan, Sebastien Biraud. Overview. Motivation Data Frontal Identification

E N D
Sources of Synoptic CO2 Variability in North America Nick Parazoo Atmospheric Science Colorado State University ChEAS, June 5, 2006 Acknowledgments: Scott Denning, Ken Davis, Arlyn Andrews, Doug Worthy, Larry Flanagan, Sebastien Biraud
Overview • Motivation • Data • Frontal Identification • Preliminary Results • Future Research
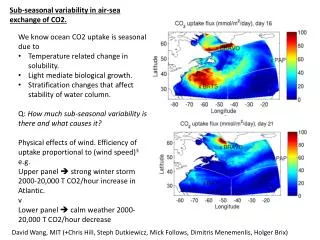
Motivation • Inversion calculations are constrained by atmospheric CO2 measurements, which are becoming more continental and high frequency • Continental measurements contain much information regarding regional scale processes • To take full advantage of the measurements requires an understanding of processes driving the high-frequency variability
Factors Influencing Continental Surface CO2 Concentrations (Geels et al., 2004) • Regional Surface CO2 fluxes from biosphere and anthropogenic sources • Near surface mixing due to BPL growth controls signal by changing volume over which CO2 flux is spread • Synoptic meteorological systems are responsible for vertical mixing and horizontal mixing
Scales of Variability • Study focuses the coupling of atmospheric dynamics and surface fluxes during non fair-weather conditions
Synoptic CO2 Patterns • Wang 2005 studied the effect of frontal passage on the CO2 signal using obs and a mesoscale model • Based on frontal identification from surface maps and data from 1997-2001, he found a prominent signal during summertime frontal passages at WLEF
Research Goals • Analyze mixing ratios from additional stations, test whether similar/other patterns exist across North America, and determine whether seasonality to the patterns exist • Seasonality may be explained in part by mixing of horizontal [CO2] gradients across the continent which occurs during air mass replacement • Szabo et al 2006 studied concentration footprints using lagrangian trajectory model (HYSPLIT4) • Determine contribution of physical and biological processes to signal using either coupled mesoscale land-surface model or global transport model
Seasonality of N-S gradient • Gradients are controlled by differences in biospheric flux across the continent and change sign: concentration approximately increases with latitude in winter and decreases with latitude during growing season
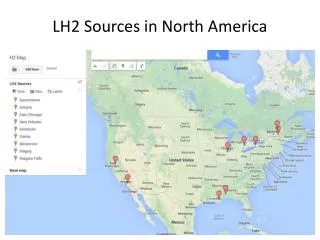
Additional Mixing Ratio Data • Well calibrated mixing ratio data are available at the following stations for most of 2003 and 2004: • WLEF (1997-05, 45.95N, -90.27W), Ken Davis, 30-396m, 1hr • ARM (2002-04, 36.61N, -97.49W), Sebastien Biraud, 4, 25, 60m, 1hr • AMT (2003-05, 45.03N, -68.68W), Arlyn Andrews, 12, 107m, 1hr • Fraserdale (2003-04, 49.88N, -81.57W), Doug Worthy, 40m, 1hr • BERMS (2003-04, 53.98N, -105.12W), Doug Worthy, 30m, 1hr • Western Peatland (2003-05, 54.95N, -112.47W), Larry Flanagan, 9m, 30min • KWKT soon hopefully!
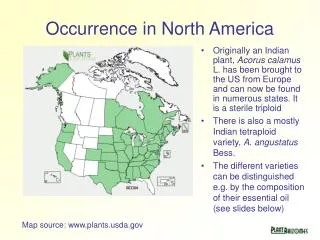
Site Characteristics • Represent four different regions in North America • Boreal Canada (BERMS/WPL) • Northeast (AMT) • Upper Midwest (WLEF/FRS) • Southern Great Plains (KWKT/ARM) • Each region is influenced by different air masses and seasonal circulation patterns • For example, Higuchi et al 2003 note that Fraserdale has four main different seasonal circulation patterns and is influenced by three distinct air masses due to the location of the Arctic front
Frontal Locator Function • Wang identified fronts using combination of surface maps and wind observations • Objective frontal analysis more efficient • Renard and Clarke define a “frontal locator function” based on their definition of a front as a “warm-air boundary of a synoptic-scale baroclinic zone of distinct thermal gradient,” and later note that “frontal-zone boundaries are considered as quasi first-order thermal and moisture discontinuities.”
Frontal Locator Function • The time at which magnitude of gradient of theta changes the most rapidly defines the trough (minimum GG) and ridge (maximum GG) • McCann and Whistler 2001 suggest ‘unnormalized’ version for use with any measure of density • Designed for gridded data, try applying to time series
Frontal Locator Using GEOS4 • 1.25x1 deg, 3-hourly, reanalysis • Choose nearest grid point to station • Basically matches synoptic variability at stations • For frontal locator, remove diurnal cycle using Butterworth filter
Frontal Locator Test • Reproduced composite CO2 pattern found by Wang at WLEF
More Plots (Winter, LEF) • Peak prior to frontal passage. Weather has less impact on ecosystem response than in summer case since ecosystem is dormant. Time scale of ~ 1 day for signal to mix out.
More Plots (Fall, LEF) • Peak prior to frontal passage. Pattern is similar to winter case except stronger amplitude. Weather has more impact on ecosystem response than in winter case.
Future Work • Apply frontal locator function to other stations and look for patterns • Set up modeling experiment to give physical explanation to patterns • 2 options: • SiB-RAMS. Wang reproduced most of signal at WLEF for summertime cold front using constant background CO2 at boundaries. • SiB-PCTM. Lokupitiya reproduced much of synoptic signal at WLEF.
SiB-PCTM • SiB-PCTM (blue) and WLEF-396m (red) from Mar23 - Oct17, 2003 • Has difficulties in early spring but captures variability in the summer and early fall
References • Geels, C et al. Investigating the sources of synoptic variability in atmospheric CO2 measurements over the Northern Hemisphere continents: a regional model study. Tellus B. 2004, 35-50. • McCann, D. Whistler, J. Problems and solutions for drawing fronts objectively. 2001. Meteorol. Appl, 8, 195-203. • Renard, R. Clarke, L. Experiments in numerical objective frontal analysis. Monthly Weather Review. 1965, 547-56. • Szabo, T. Barcza, Z. Haszpra, L. Aalto, T. Variability in Atmospheric CO2 mixing ratio reflected by tall tower measurements. 2006. Poster. • Wang, Jih_Wang. Observations and simulations of synoptic, regional, and local variations in atmospheric CO2. Thesis, 2005.