Download
1 / 32
320 likes | 509 Views
Principles of Memory Organization in the Monkey Medial Temporal Lobe. Wendy A. Suzuki Center for Neural Science New York University. 30-60%. 18-29%. 5-17%. <5%. TE STSv TEO. STSd. STG. Pi. 24/25/32. 46. 11/12. 7a/LIP. Ia. Id. 13. 23/29/30. Ig. V4. Parietal Lobe.

E N D
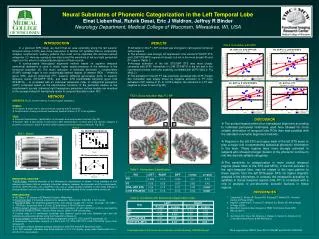
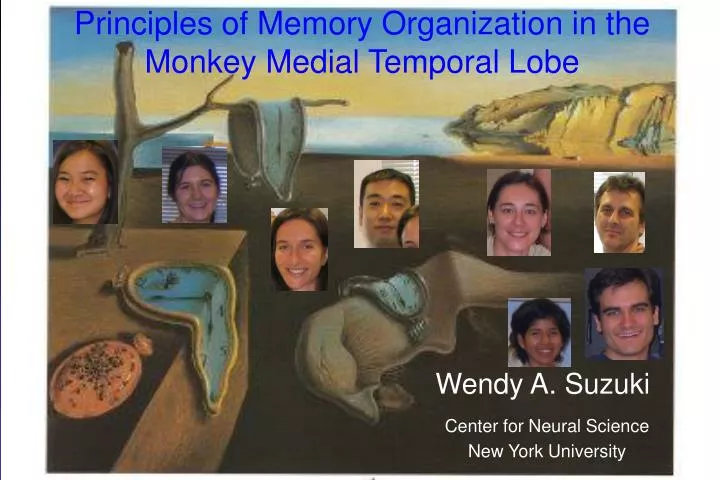
Principles of Memory Organization in the Monkey Medial Temporal Lobe WendyA. Suzuki Center for Neural Science New York University
30-60% 18-29% 5-17% <5% TE STSv TEO STSd STG Pi 24/25/32 46 11/12 7a/LIP Ia Id 13 23/29/30 Ig V4 Parietal Lobe Frontal Lobe Temporal Lobe Insular Cortex Cingulate Gyrus DG HPC Sub Entorhinal Parahippocampal Perirhinal Suzuki and Amaral, 1994
Take Home Message: • All structures of the MTL appear to provide a similar complement of associative learning-related signals.
30-60% 18-29% 5-17% <5% TE STSv TEO STSd STG Pi 24/25/32 46 11/12 7a/LIP Ia Id 13 23/29/30 Ig V4 Parietal Lobe Frontal Lobe Temporal Lobe Insular Cortex Cingulate Gyrus DG HPC Sub Entorhinal Parahippocampal Perirhinal Suzuki and Amaral, 1994
Take Home Message: • All structures of the MTL appear to provide a similar complement of associative learning-related signals. • There appears to be a conditionally dynamic relationship between different MTL structures such that depending on task demands different MTL structure can either contribute in similar/cooperative ways or in more clearly distinct way to mnemonic functions.
+ + New Scenes (n = 2-4) + Fixation/ Baseline (300 ms) Scene/Target Presentation (500 ms) Delay (700 ms) Eye Movement Response Location-Scene Association Task Gaffan (1994), Murray and Wise (1996), Murray et. al., (1998)
50 40 30 Response (Spikes/Sec) 20 10 0 Baseline Activity -10 Behavioral Learning Curve and Delay Activity Over Time to Scene 653 1 0.8 0.6 Probability Correct 0.4 0.2 0 0 10 20 30 40 50 Wirth et al., 2003 C110600.4 Trials
Behavioral Learning Curve and Delay Activity Over Time to Scene 386 1 16 14 0.8 12 10 0.6 Probability Correct Response (Spikes/Sec) 8 0.4 6 4 0.2 2 0 0 1 4 7 10 13 16 19 22 25 28 31 34 37 Trials Wirth et al., 2003
2 Categories of Changing Cells A. Sustained Changing cells: 56% of all changing cells B. Baseline Sustained Changing cells: 44% of all changing cells
What about the Perirhinal cortex? Yanike et al., 2008, In press
PR Cortex (n = 2 monkeys) • 83/128 (65 %) • 26/83 (31%) • 8/26 (31%) • 18/26 (69%) Hippocampus (n = 2 monkeys) • Selective • 89/145 (61 %) • Changing Cells • 25/89 (28%) • Sustained • 14/25 (56%) • Baseline Sustained • 11/25 (44%)
Object 1 Object 2 Place 1 Late + Early + + Place 2 Early + Late Object-Place Association Task Bar Release Period Bar Release Period + + + + + + + + + + + + + + + + + + + + Fixation Fixation Cue Cue Delay Delay Early Early Late Late Reward Reward ITI ITI 500ms 500ms 500ms 500ms 700ms 700ms 500ms 500ms 500ms 500ms 2000ms 2000ms Wirth et al, 2009
+ + + + + + + + Cue Fixation Delay Early 500ms 500ms 700ms 500ms Reward + + + + + + + + + + Cue Fixation Delay Early Late 500ms 500ms 700ms 500ms 500ms Correct Trial ITI Release Incorrect Trial No Reward ITI Release Wirth et al, 2009
Do hippocampal cells differentiate between correct and error trials? 50% are outcome-selective
Correct Up Cells N = 30 Error Up Cells N = 38 Wirth et al, 2009
+ + + + + ITI Reward Cue Delay Fixation 2000ms 500ms 700ms 500ms Standard Trials Bar Release Period + + + + + + + + + + Cue Fixation Delay Early Late Reward ITI 500ms 500ms 700ms 500ms 500ms 2000ms Fixation Only Trials
Correct Up Cells N = 30 Error Up Cells N = 38 Wirth et al, 2009
+ + + + + ITI Reward Cue Delay Fixation 2000ms 500ms 700ms 500ms Standard Trials Bar Release Period + + + + + + + + + + Cue Fixation Delay Early Late Reward ITI 500ms 500ms 700ms 500ms 500ms 2000ms Fixation Only Trials
Correct Up Cells N = 30 Error Up Cells N = 38 Wirth et al, 2009
Object 1 Object 2 Place 1 Late + Early + + Place 2 Early + Late Object-Place Association Task Bar Release Period Bar Release Period + + + + + + + + + + + + + + + + + + + + Fixation Fixation Cue Cue Delay Delay Early Early Late Late Reward Reward ITI ITI 500ms 500ms 500ms 500ms 700ms 700ms 500ms 500ms 500ms 500ms 2000ms 2000ms Wirth et al, 2009
30-60% 18-29% 5-17% <5% TE STSv TEO STSd STG Pi 24/25/32 46 11/12 7a/LIP Ia Id 13 23/29/30 Ig V4 Parietal Lobe Frontal Lobe Temporal Lobe Insular Cortex Cingulate Gyrus DG HPC Sub Entorhinal Parahippocampal Perirhinal Suzuki and Amaral, 1994
Take Home Message: • All structures of the MTL appear to provide a similar complement of associative learning-related signals. • There appears to be a conditionally dynamic relationship between different MTL structures such that depending on task demands different MTL structure can either contribute in similar/cooperative ways or in more clearly distinct way to mnemonic functions.
Encoding Phase 1st Cue 2nd Cue Temporal Order Task Small Reward 0.4 s 0.3 s 0.9 s 0.3 s 0.5 s Retrieval Phase Inter-phase Delay Pre-response Delay 1st Choice 2nd Choice Large Reward 0.7-1.5 s 1.0 s > 4.0 s Naya and Suzuki, SFN 2008
30-60% 18-29% 5-17% <5% TE STSv TEO STSd STG Pi 24/25/32 46 11/12 7a/LIP Ia Id 13 23/29/30 Ig V4 Parietal Lobe Frontal Lobe Temporal Lobe Insular Cortex Cingulate Gyrus DG HPC Sub Entorhinal Parahippocampal Perirhinal Suzuki and Amaral, 1994
Findings • The most stimulus selective response are found in area TE and the perirhinal cortex. • Perirhinal cortex has the strongest proportion of order and stimulus selective responses • The hippocampus has the highest proportion of trial outcome selective responses.
Take Home Message: • All structures of the MTL appear to provide a similar complement of associative learning-related signals. • There appears to be a conditionally dynamic relationship between different MTL structures such that depending on task demands different MTL structure can either contribute in similar/cooperative ways or in more clearly distinct way to mnemonic functions.
Sylvia Wirth Marianna Yanike Emin Avsar
Eric Hargreaves Yuji Naya