Download
1 / 40
440 likes | 847 Views
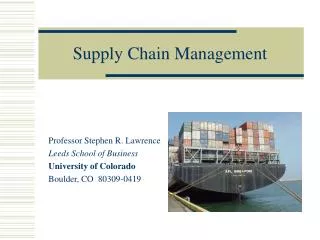
Operations Management: Supply Chain Management Module. Managing the Supply Chain Key to matching demand with supply Cost and Benefits of inventory Economies of Scale Factors affecting optimal batch size: EOQ Levers for improvement Safety Stock Factors affecting level of safety stock: ROP

E N D
Operations Management: Supply Chain Management Module • Managing the Supply Chain • Key to matching demand with supply • Cost and Benefits of inventory • Economies of Scale • Factors affecting optimal batch size: EOQ • Levers for improvement • Safety Stock • Factors affecting level of safety stock: ROP • Levers for reducing safety stock • Improving Performance • Centralization & Pooling efficiencies • Postponement • Accurate Response S. Chopra/Operations/Supply Chain Mgt
Corporate Finance • Inventories represent about 34% of current assets for a typical US company; 90% of working capital. • For each dollar of GNP in the trade and manufacturing sector, about 40% worth of inventory was held. • Average logistics cost = 21c/sales dollar = 10.5% of GDP S. Chopra/Operations/Supply Chain Mgt
The Supply Chain The Procurement or supply system The Operating System The Distribution System Finished Goods Storage Raw Material supply points Raw Material Storage Movement/ Transport Manufacturing Movement/ Transport Movement/ Transport Movement/ Transport PLANT 1 WAREHOUSE A STORAGE PLANT 2 WAREHOUSE B STORAGE PLANT 3 WAREHOUSE C STORAGE MARKETS S. Chopra/Operations/Supply Chain Mgt
Key Financial Indicators of Supply Chain Performance • Return on Assets • Net Present Value • … • … These are LAGGING indicators. What must the supply chain do to achieve this? S. Chopra/Operations/Supply Chain Mgt
Costs of not Matching Supply and Demand • Cost of overstocking • liquidation, obsolescence, holding • Cost of under-stocking • lost sales and resulting lost margin S. Chopra/Operations/Supply Chain Mgt
Accurately Matching Demand with Supply is the Key Challenge: Inventories • ... by 1990 Wal-Mart was already winning an important technological war that other discounters did not seem to know was on. “Wal-Mart has the most advanced inventory technology in the business and they have invested billions in it”. (NYT, Nov. 95). • WSJ, Aug. 93: Dell Computer stock plunges. The company was sharply off in forecast of demand resulting in inventory writedowns. • BW 1997: S. Chopra/Operations/Supply Chain Mgt
A Key to Matching Supply and Demand When would you rather place your bet? A B D C A: A month before start of Derby B: The Monday before start of Derby C: The morning of start of Derby D: The winner is an inch from the finish line S. Chopra/Operations/Supply Chain Mgt
Where is the Flow Time? Operation Buffer Processing Waiting S. Chopra/Operations/Supply Chain Mgt
Why do Buffers Build? Why hold Inventory? Cycle/Batch stock • Economies of scale • Fixed costs associated with batches • Quantity discounts • Trade Promotions • Uncertainty • Information Uncertainty • Supply/demand uncertainty • Seasonal Variability • Strategic • Prices, availability Safety stock Seasonal stock Strategic stock S. Chopra/Operations/Supply Chain Mgt
manufacturer retailer Palü Gear: Retail Inventory Management & Economies of Scale Annual jacket revenues at a Palü Gear retail store are roughly $1M. Palüjackets sell at an average retail price of $325, which represents a mark-up of 30% above what Palü Gear paid its manufacturer. Being a profit center, each store made its own inventory decisions and was supplied directly from the manufacturer by truck. A shipment up to a full truck load, which was over 3000 jackets, was charged a flat fee of $2,200. Stores typically ordered 1500 jackets at a time, twice a year. (Palü’s cost of capital is approximately 20%.) What order size would you recommend for a Palü store in current supply network? S. Chopra/Operations/Supply Chain Mgt
Inventory Profile: # of jackets in inventory over time. Inventory Q R = Demand rate Time t Economies of Scale: Inventory Build-Up Diagram R: Annual demand rate, Q: Number of jackets per replenishment order • Number of orders per year = R/Q. • Average number of jackets in inventory = Q/2 . S. Chopra/Operations/Supply Chain Mgt
Costs Associated with Batches • Order costs (S) • Changeover of production line • Transportation • Receiving • Holding costs (H = rC) • Physical holding cost • Cost of capital • Cost of obsolescence S. Chopra/Operations/Supply Chain Mgt
Palü Gear: evaluation of current policy of ordering Q = 1500 units each time • What is average inventory I? • I = Q/2 = • Annual cost to hold one unit H = • Annual cost to hold I = Holding cost × Inventory • How often do we order? • Annual throughput R = • # of orders per year = Throughput / Batch size • Annual order cost = Order cost × # of orders • What is total cost? • TC = Annual holding cost + Annual order cost = • What happens if order size changes? S. Chopra/Operations/Supply Chain Mgt
Find most economical order quantity: Spreadsheet for a Palü Gear retailer S. Chopra/Operations/Supply Chain Mgt
Total annual costs H Q/2: Annual holding cost S R /Q:Annual setup cost EOQ Batch Size Q Economies of Scale: Economic Order Quantity EOQ R : Demand per year, S : Setup or Order Cost ($/setup; $/order), H : Marginal annual holding cost ($/per unit per year), Q : Order quantity. C : Cost per unit ($/unit), r+h: Holding cost % (%/yr), H = (r+h) C. S. Chopra/Operations/Supply Chain Mgt
Optimal Economies of Scale: For a Palü Gear retailer R= 3077 units/ year C = $ 250 / unit r = 0.20/year S = $ 2,200 / order Unit annual holding cost = H = Optimal order quantity = Q = Number of orders per year = R/Q = Time between orders = Q/R = Annual order cost = (R/Q)S = $13,008.87/yr Average inventory I = Q/2 = Annual holding cost = (Q/2)H =$13,008.87/yr Average flow time T = I/R = S. Chopra/Operations/Supply Chain Mgt
Learning Objectives: Batching & Economies of Scale • Average inventory for a batch size of Q is Q/2. • Increasing batch size of production (or purchase) increases average inventories (and thus cycle times). • The optimal batch size trades off setup cost and holding cost. • To reduce batch size, one has to reduce setup cost (time). • Square-root relationship between Q and (R, S): • If demand increases by a factor of 4, it is optimal to increase batch size by a factor of 2 and produce (order) twice as often. • To reduce batch size by a factor of 2, setup cost has to be reduced by a factor of 4. S. Chopra/Operations/Supply Chain Mgt
Role of Leadtime L:Palü Gearcont. • The lead time from when a Palü Gear retailer places an order to when the order is received is two weeks. If demand is stable as before, when should the retailer place an order? • I-Diagram: • The two key decisions in inventory management are: • How much to order? • When to order? S. Chopra/Operations/Supply Chain Mgt
Demand uncertainty and forecasting • Forecasts are usually (always?) wrong. • A good forecast has at least 2 numbers (includes a measure of forecast error, e.g., standard deviation). • The forecast horizon must at least be as large as the lead time. The longer the forecast horizon, the less accurate the forecast. • Aggregate forecasts tend to be more accurate. S. Chopra/Operations/Supply Chain Mgt
Palü Gear:Service levels & inventory management • In reality, a Palü Gearstore’s demand fluctuates from week to week. In fact, weekly demand at each store had a standard deviation of about 30 jackets assume roughly normally distributed. Recall that average weekly demand was about 59 jackets; the order lead time is two weeks; fixed order costs are $2,200/order and it costs $50 to hold one jacket in inventory during one year. • Questions: • If the retailer uses the ordering policy discussed before, what will the probability of running out of stock in a given cycle be? • The Palü retailer would like the stock-out probability to be smaller. How can she accomplish this? • Specifically, how does it get the service level up to 95%? J.A. Van Mieghem/Operations/Supply Chain Mgt
Example: say we increase ROP to 140 (and keep order size at Q = 520) • On average, what is the stock level when the replenishment arrives? • What is the probability that we run out of stock? • How do we get that stock-out probability down to 5%? S. Chopra/Operations/Supply Chain Mgt
R L Safety Stocks Inventory on hand I(t) Q Q order order order ROP mean demand during supply lead time: m = R L Is safety stock Is 0 Time t L L S. Chopra/Operations/Supply Chain Mgt
1. How to find service level (given ROP)?2. How to find re-order point (given SL)? • L = Supply lead time, • D =N(R, sR) = Demand per unit time is normally distributed with mean R and standard deviation sR , • DL=N(m, s) = Demand during the lead time where m = RL and s = sRL • Given ROP, find SL = Cycle service level = P(no stock out) = P(demand during lead time <ROP) = F(z*= (ROP- m)/s) [use table] = NORMDIST(ROP, m, s, True) [or Excel] • Given SL, find ROP = m + Is = m + z*s [use table to get z* ] = m + NORMSINV(SL)*s [or Excel] Safety stock Is= z*sReorder point ROP = m + Is S. Chopra/Operations/Supply Chain Mgt
F(z) z 0 The standard normal distribution F(z) • Transform X = N(m,s) to z = N(0,1) • z = (X - m) / s. • F(z) = Prob( N(0,1) <z) • Transform back, knowing z*: • X* = m + z*s. S. Chopra/Operations/Supply Chain Mgt
Palü Gear: Determining the required Safety Stock for 95% service DATA: R= 59 jackets/ week sR = 30 jackets/ week H = $50 / jacket, year S = $ 2,200 / order L = 2 weeks QUESTION: What should safety stock be to insure a desired cycle service level of 95%? ANSWER: 1. Determine slead time demand = 2. Required # of standard deviations z* = 3. Answer: Safety stock Is = S. Chopra/Operations/Supply Chain Mgt
Comprehensive Financial Evaluation:Inventory Costs of Palü Gear 1. Cycle Stock (Economies of Scale) 1.1 Optimal order quantity = 1.2 # of orders/year = 1.3 Annual ordering cost per store = $13,009 1.4 Annual cycle stock holding cost. = $13,009 2. Safety Stock (Uncertainty hedge) 2.1Safety stock per store = 70 2.2 Annual safety stock holding cost = $3,500. 3. Total Costs for 5 stores = 5 (13,009 + 13,009 + 3,500) = 5 x $29,500 = $147.5K. S. Chopra/Operations/Supply Chain Mgt
Learning Objectives safety stocks Levers to decrease safety stock without hurting level of service: • Decrease demand variability or forecast error, • Decrease delivery lead time, • Decrease delivery lead time variability. S. Chopra/Operations/Supply Chain Mgt
Improving Supply Chain Performance:1. The Effect of Pooling/Centralization S. Chopra/Operations/Supply Chain Mgt
Palü Gear’s Internet restructuring: Centralized inventory management • Weekly demand per store = 59 jackets/ week with standard deviation = 30 / week H = $ 50 / jacket, year S = $ 2,200 / order Supply lead time L = 2 weeks Desired cycle service level F(z*) = 95%. • Palü Gearnow is considering restructuring to an Internet store. m= s = S. Chopra/Operations/Supply Chain Mgt
Palü Gear’s Internet restructuring: comprehensive financial inventory evaluation 1. Cycle Stock (Economies of Scale) 1.1 Optimal order quantity = 1.2 # of orders/year = 1.3 Annual ordering cost of e-store = $29,089 1.4 Annual cycle stock holding cost = $29,089 2. Safety Stock (Uncertainty hedge) 2.1Safety stock for e-store = 2.2 Annual safety stock holding cost = $7,800. 3. Total Costs for consolidated e-store = 29,089 + 29,089 + 7,800 = $65,980. S. Chopra/Operations/Supply Chain Mgt
Generic Power Production Unique Power Production Transportation Europe Process I: Unique Power Supply N. America Europe Process II: Universal Power Supply N. America Make-to-Stock Push-Pull Boundary Make-to-Order Improving Supply Chain Performance: 2. Postponement & Commonality (HP Laserjet) S. Chopra/Operations/Supply Chain Mgt
Learning Objectives: Supply Chain Performance • Pooling of stock reduces the amount of inventory • physical • information • specialization • substitution • commonality/postponement • Benetton: Tailored response (e.g., partial postponement) can be used to better match supply and demand Single product Multi product S. Chopra/Operations/Supply Chain Mgt
Demand forecast for Christmas jackets 18% 16% 16% 16% 14% 13% 13% 12% 10% 10% 10% 8% 6% 6% 6% 4% 3% 3% 2% 1% 1% 1% 1% 0% 800 1000 1200 1400 1600 1800 2000 2200 2400 2600 2800 3000 3200 Optimal Service Level in Response to Demand Uncertainty when you can order only once: Palü Gear • Palü Gear’s is planning to offer a special line of winter jackets, especially designed as gifts for the Christmas season. Each Christmas-jacket costs the company $250 and sells for $450. Any stock left over after Christmas would be disposed of at a deep discount of $195. Marketing had forecasted a demand of 2000 Christmas-jackets with a forecast error (standard deviation) of 500 • How many jackets should Palü Gear order? S. Chopra/Operations/Supply Chain Mgt
In reality, you do not know demand for sure…Impact of uncertainty if you order the expected Q = 2000 S. Chopra/Operations/Supply Chain Mgt
What happens if you change your order level to hedge against uncertainty? Performance for all possible Q using Excel • 200 D -55 = F(Q) S. Chopra/Operations/Supply Chain Mgt
Do not sell the extra unit with probability … Sell the extra unit with probability … DP = ….. DP = ….. Expected profit from additional unit E(DP) = So? ... Order more? Towards the newsboy model Suppose you placed an order of 2000 units but you are not sure if you should order more. What happens if I order one more unit (on top of Q = 2000)? S. Chopra/Operations/Supply Chain Mgt
Accurate response: Find optimal Q from newsboy model • Cost of overstocking by one unit = Co • the out-of-pocket cost per unit stocked but not demanded • “Say demand is one unit below my stock level. How much did the one unit overstocking cost me?” E.g.: purchase price - salvage price. • Cost of understocking by one unit = Cu • The opportunity cost per unit demanded in excess of the stock level provided • “Say demand is one unit above my stock level. How much could I have saved (or gained) if I had stocked one unit more?” E.g.: retail price - purchase price. Given an order quantity Q, increase it by one unit if and only if the expected benefit of being able to sell it exceeds the expected cost of having that unit left over. Marginal Analysis: Order more as long as F(Q) < Cu/ (Co + Cu) • = smallest Q such that service level F(Q) > critical fractile Cu/ (Co + Cu) S. Chopra/Operations/Supply Chain Mgt
Where else do you find newsboys? • Deciding on economic service level • Benefits: Flexible Spending Account decision • ATM • Capacity Mgt S. Chopra/Operations/Supply Chain Mgt
Goal of a Supply Chain Match Demand with Supply It is hard … Why? Economies of Scale There are fixed costs of ordering/production Q*= Implications: How fast cycle inventory grows if demand grows. How much to invest in fixed cost reduction to reduce batch size. Hard to Anticipate Demand Forecasts are wrong… why? There is lead time… why there is lead time? Lead time (flow time) = Activity time+ Waiting Time Because there is waiting time.. Why there is waiting time? There is inventory in the SC (Little’s Law) Implications: Is z (service level appropriate) Reduce Lead time Reduce sR Uncertainty Forecast Error Safety Stock Is= zsR Why there is Inventory? Seasonality S. Chopra/Operations/Supply Chain Mgt
How do we deal with it? • Aggregation • Physical • Information • Specialization • Component Commonality • Postponement Customer Demand Uncertainty Normal Variations… Implications: Is z (service level appropriate) Reduce Lead time Reduce sR Balance overstocking and understocking Newsboy Problem … Critical Fractile = 1- P(stockout) Where does sR come from? Information Uncertainty S. Chopra/Operations/Supply Chain Mgt