Download
1 / 48
480 likes | 646 Views
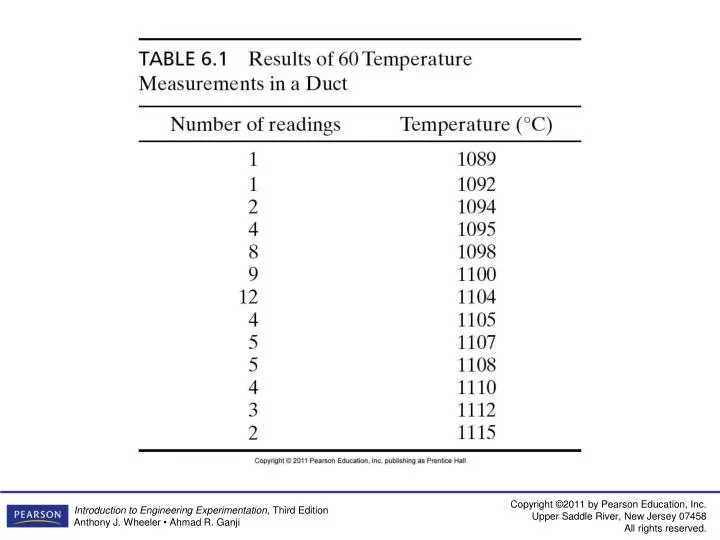
Figure 6.1 Histogram of temperature data. Figure 6.2 Some shapes of distributions: (a) symmetric; (b) skewed; (c) J-shaped; (d) bimodal; (e) uniform. (After Johnson, 1988.). Figure 6.3 Relative frequencies of duct temperatures. Figure E6.1. Figure E6.2.

E N D
Figure 6.2 Some shapes of distributions: (a) symmetric; (b) skewed; (c) J-shaped; (d) bimodal; (e) uniform. (After Johnson, 1988.)
Table 6.3 (continued) Area Under the Normal Distribution From z = 0 to z
Table 6.3 (continued) Area Under the Normal Distribution From z = 0 to z
Table 6.3 (continued) Area Under the Normal Distribution From z = 0 to z
Figure 6.8 Probability density function using the Student’s t-distribution.
Figure 6.11 Confidence interval for the chi-squared distribution.
Table 6.7 (continued) Critical Values of the Chi-Squared Distribution
Table 6.7 (continued) Critical Values of the Chi-Squared Distribution
Figure 6.12 Data showing variation in scatter of the dependent variable, y.
Table 6.9 (continued) Minimum Values of the Correlation Coefficient for Significance Level