Download
1 / 51
510 likes | 605 Views
Keith Torgerson, NDSCS. Farms in the Annual Red River Valley Annual Report. FINAN, the analysis software, allows us to take a closer look at the farms in a region or state. We can create summaries of: Farm Size (based on Gross Income) Type of Farm (based on 70% of gross income)

E N D
Farms in the Annual Red River Valley Annual Report • FINAN, the analysis software, allows us to take a closer look at the farms in a region or state. • We can create summaries of: • Farm Size (based on Gross Income) • Type of Farm (based on 70% of gross income) • Age of Operator • Other special sorts based on location, production practices, enterprise selection and size, etc.
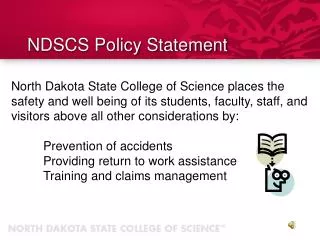
Farm Management Education Is Concerned With: • Creating an awareness of the need for accurate financial & enterprise records. • Stimulating individuals and families to establish goals and set priorities. • Developing the farm operator’s understanding of the function of management.
Farm Management Education Is Concerned With: • Developing fundamentals of resource management (Financial & Human). • Developing student skills in analyzing and interpreting farm business records. • Developing skills in analyzing data to improve the organization and efficiency of the farm business.
Ask Yourself these Questions. • How do I compare? • With my previous farm history? • With local or county information? • With area and statewide information? • Is my farm getting the financial returns that I want or need? • How do I go about making my farm business more efficient or profitable?
How Should I Use the Data • Compare your financial and crop numbers to your peer group
Total Farm Assets • Total farm assets increased $369,851 over last year. (Cost) • 2006 $1,162,753 • 2007 $1,319,822 • 2008 $1,594,701 • 2009 $1,545,551 • 2010 $1,843,439 • 2011 $1,956,332 • 2012 $2,331,862 • 2013 $2,701,713
Total Farm Liabilities • Total farm liabilities increased $178,123 from last year And $260,915 over the last two years • 2006 $543,610 • 2007 $576,908 • 2008 $681,055 • 2009 $683,852 • 2010 $735,208 • 2011 $755,356 • 2012 $838,328 • 2013 $1,016,451
Net Worth Change • This year we had a negative Net Worth change of $-45,911. • 2007 $161,030 • 2008 $165,651 • 2009 $6,849 • 2010 $269,511 • 2011 $198,267 • 2012 $392,774 • 2013 -$45,911
Farm Receipts • Gross Farm receipts increased by $41,093 due mainly to the large amount of 2012 inventory sold in 2013 • 2005 $546,515 • 2006 $604,651 • 2007 $729,735 • 2008 $897,727 • 2009 $843,024 • 2010 $931,278 • 2011 $1,104,412 • 2012 $1,163,839 • 2013 $1,122,746
Government PaymentsThis includes direct, crp, and disaster payments. • 2005 $54,301 • 2006 $29,339 • 2007 $26,431 • 2008 $36,533 • 2009 $23,746 • 2010 $39,737 • 2011 $36,606 • 2012 $22,152 • 2013 $32,384
Farm Expenses • Cash farm expenses decreased $43,738 • 2004 $427,807 • 2005 $454,623 • 2006 $508,716 • 2007 $602,429 • 2008 $718,042 • 2009 $651,196 • 2010 $701,797 • 2011 $789,890 • 2012 $850,730 • 2013 $806,992
How the $941,260 was spent including family living and income taxes. The three largest expense are seed, fertilizer and rent.
Net Farm Income • This is the net cash farm income after being adjusted first for inventory change and than for depreciation • This is the calculated profit for the year • If more money than indicated on net farm income is spent on family living, personal taxes, and new investments, it must be taken from inventory sales, the capital replacement dollars, new borrowings, or from off farm income. It is also calculated under the cost balance sheet.
Net Farm Income For Valley • Net farm income for farms in the Valley averaged $61,749 which was a decrease of $474,973 from 2012. • Net farm income for the low 20% of the farms averaged a negative $164,215 • Net farm income for the high 20% of the farms averaged $279,501 • Net farm income for the people in the 40%-60% averaged $61,080 • The large decrease in Net Farm income was due to lower yields, lower prices, and higher input costs
Crops and Feed Inventory Change • This year we had a negative inventory change of $179,658 compared to a positive inventory change of $291,127 last year
$ Expense/$ Income • In 2013 it cost a Valley farmer about 82.6 cents (accrual) compared to 55.4 cents (accrual) in 2012 to make a dollar’s worth of income. This number is the operating expense ratio and does not include interest or depreciation expense.
Machinery and Buildings Purchased • Machinery purchased for the year was $163,947 down $22,803 from last year. • Buildings purchased during the year averaged $32,850 per farm.
Non Farm Income • Average Personal Income was $22,187
Net Return for Crops • Does not include Acre Payments or Disaster Payments • Does include Crop Insurance and RA and CRC insurance
Spring Wheat Yield Wheat yield increased about 5 bushels per acre from 2012
Spring Wheat Net Return/Acre • The net return per acre of wheat on cash rented land was positive this year • 2013 Average $29.85 Low 20% -$97.05 High 20% $112.48
Soybeans Yield for 2013 was 34.3 bu per acre down about 5 bushels from 2012
Corn Yields & Net Return per Acre Yield Net Return • 2007 131 bu $140.54 • 2008 155 bu $132.49 • 2009 132 bu -$47.95 • 2010149 bu $196.89 • 2011 114 bu $154.78 • 2012 144 bu $331.42 • 2013 139 bu $62.04
Average Working Capital decreased by $121,394 and the low 20% increased due some high profit farms slipping into the low 20% this year
Operating Expense Ratio increased About 27.2% for each group from last year
Conclusions about the ratios • Start to compare your information to the last 3 to 5 years of data. • Determine your own trend lines. • Compare your data to the area averages. • How does your business stack up? • Evaluate possible changes if needed. • Consider the following flow chart in making future business decisions
If both asset turnover and operating profit are at acceptable levels, then increase size Acceptable Operating Profit Margin Acceptable Needs Improvement Look for ways to increase the revenues generated from existing assets. Look at cost controls. Look for ways to decrease expenses without reducing revenues. ASSET TURNOVER Needs Improvement Look for non-performing/under-performing assets to cull. Flowchart for Assessing and Improving Farm Profitability Re-evaluate: • Thruput • Crop Mix/Product Mix • Marketing Program • Yields • Resource Use • Custom Work Enterprise Re-evaluate: • Production Costs • Rents • Capital Spending Plans • Purchasing Practices • Family Needs • Business Organization • Financing Costs • Employment • Inventory Management • Outsourcing • Records • Control Procedures • Management’s Priorities Re-evaluate: • Leasing versus Owning Assets • Custom Work versus Owning Underutilized Machinery • Sharing Assets (Partnering) Source: Purdue University
Where are we headed? • Major increase in the use technology. • Precision agriculture • Biotechnologies (Livestock & Crops) • Internet • Find new Suppliers, products, markets • Evaluating new technologies or products • E-Commerce • Are you working with partners to use capital more efficiently? • Is your business a low cost producer? • How about value added industries???
For More Information For more information in Minnesota call 1-800-959-6282 ext. 8747 Northland Community and Technical College In North Dakota Call the CTE Agriculture Supervisor @ 701-328-3162