Download
1 / 33
330 likes | 350 Views
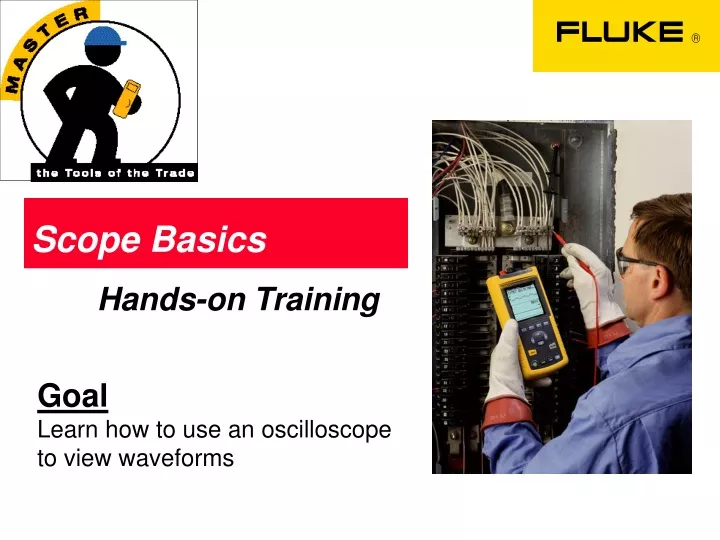
This hands-on training will teach you the basics of using an oscilloscope to view and analyze waveforms. No prior experience necessary!

E N D
Scope Basics Hands-on Training Goal Learn how to use an oscilloscope to view waveforms
I GIVE UP!! • Two electricians walked off the job. • The problem is that the internal batteries would not charge. • I did not know what to try next. I need something to show me what is going on!
What Is a Waveform? Waveform Amplitude Time Waveform - A graphic visual display of amplitude Vs time.
What Does the Waveform Tell Me? A waveform will give you the whole picture of whatever you are investigating.
Waveform Terminology What is? : Rise time /Fall time Frequency /Period Peak to Peak / Peak Pulse /Pulse Width Duty Cycle Noise Phase Glitch/Spike
Rise Time / Fall Time The time it takes for a waveform to travel from the 10% point to the 90% point. Value is expressed in seconds The time it takes for a waveform to travel from the 90% point to the 10% point. Value is expressed in seconds
Frequency / Period Frequency - A value expressed in Hz that represents the number of times a waveform repeats every second (I.e. 60Hz). Period - The time it takes for a waveform to complete one cycle or event. Period = 1/ Frequency.
Peak to Peak / Peak Peak to peak - The amplitude of a waveform measured from the maximum point to minimum point. Peak- The amplitude of a waveform measured from the maximum to a reference point.
Pulse / Pulse Width Pulse - A type of waveform that is characterized by a fast rise and fall time. A pulse can be a repeating or single event but typically does not pass through the reference point. Pulse Width - The measurement of the duration of a pulse.
Noise Extraneous waveforms riding on and distorting a signal or level.
Phase A timing relationship between two signals. The measurement is expressed in degrees of shift.
Duty Cycle A measurement of the “on” time vs. the “off” time. The value is expressed in percent.
Glitch/Spike A quick random event that distorts the waveform. Usually switching noise.
Oscilloscope • An Oscilloscope …. a meter with pictures • Displays a signals amplitude (vertical) over a window of time (horizontal). • A Scope is to a troubleshooter, what an x-ray machine is to a doctor.
Analog and Digital Oscilloscopes There are two types of oscilloscopes Analog and Digital Analog: Conditions the waveform at the input then draws it on the CRT. Digital: Digitizes the waveform at the input, puts data in memory. A micro computer to draws the waveform on the screen.
Fluke 123 Tour Input A Input B Common Screen Navigation Keys “Soft” Keys Input A Measurement Menu Key Input B Measurement Menu Key Input A Volts/div.Key Input B Volts/div.Key Scope Mode Menu Key Auto setup Key Power Time/ div. Key User Key
Lab One - Waveform viewing 1. Connect the red probe from input A to TP 5 (Motor Drive Signal) You should see this screen: 2. Press the “ns” side of the key until you see this screen: (note: the time per div.is 100us) You are now able to view any noise or spikes that may burn out the motor.
Fixing the UPS • During a visit to a customer site we were told of a difficult problem the electrician was not able to solve. • The UPS in the computer room would not charge its batteries. • The mains were connected and the meter read the voltage. • His predecessors had resigned. • An oscilloscope was connected to the mains at the UPS. The oscilloscope (ScopeMeter) displayed this waveform
Conclusion The Meter was unable to give the answer to the problem • The tops or peak of the waveforms were missing. It turns out that this peak area was where the UPS would charge its batteries. • The reason the peaks are missing is because the UPS was physically located too far away from the electrical service connection. The peaks were the victim of too much source impedance. • A meter still displayed mains voltage but only a Oscilloscope would give the entire picture.
Updating the Sensors on a Bottling Line • In a recent system update , the trip cylinder was relocated to an earlier point on the filler, but the sensing prox. Could not be moved to the same location. • The output of the prox. Was fed to a PLC which created a delay between the can sensor and the valve actuation. • The trick was to set the PLC to maintain correct timing between the two sensor outputs, and insert a precise delay time. • The oscilloscope was used to make the timing adjustments.
Synchronizing Generators • Often there is more than one generator to be switched on and off line. • The synchronization of a generator with the frequency and phase of the power grid is important. • This synchronization can be performed by a two channel oscilloscope. It is easy to see when two waveforms are “in phase” • Then the generator can be safely brought on line.
Lab Two - Setting Trigger Level The key in obtaining a stable display is to set the trigger correctly Connect input A to TP 7. You should see this screen: Press the key. Press the until you lose the stable waveform, you should see a screen like this: Press the key, you should see a stable waveform you can now see the missing pulse.
Dual Channel Measurement • Another advantage an oscilloscope has over a meter is that a oscilloscope can display two events using the same trigger. • This is a useful function if you are viewing two events that have a relationship. • An example would be to view the line voltage and the line current. The oscilloscope we are using for the labs has two channels or inputs.
Lab Three - Dual Channel Measurement Connect Input A to TP 6 and Input B to TP 2. Press the key then press the to turn on Input B. Press twice. Now press the key. Press the and keys to select “Phase” ,press to get this screen: You are now able to measure the phase shift between the two waveforms at input A and B. If there were an adjustment you would be able to Zero out the shift.
A specialized scope for power problems Interruption Transients Harmonic Distortion impulse Under / Over Voltage Sags andSwells oscillatory Noise
Power Quality Analyzer A ScopeMeter plus…. • Harmonics Analyzer (V and I) • KW, VAR, PF, Phase angle • Capture sags, swells • Capture transients, inrush • Transformer K- factor • Waveform recorder
Scope Safety • Category ratings • Select a scope and probes and clamps for the worst case category • CAT III - 600V for industrial systems • Voltage ratings • Working voltage • Transient voltage
Scope Safety Line Powered Bench Scopes • Use a differential or isolation probe to separate the earth ground connection of the scope from high energy circuits that are also referenced to earth ground. • Isolate bench scope grounds only in conjunction with differential/isolation probes. • ‘cheater’ cords can create shock hazards
Scope Safety Battery Powered Scopes • Have inherent ground isolation for superior common mode noise rejection • Some come standard with CAT III 600 volt probes for measurements in high energy circuits
Scope Safety Probes • Beware of bench scope probes - they are usually CAT I - 500 volts • Don’t use CAT I or II divider probes on CAT III circuits • Don’t use probes with exposed metal parts • Don’t use probes without specified ratings • Read the manual for safe probe connections - they may vary greatly between instruments
Oscilloscope Safety Current Clamps • Clamps have Category and working voltage ratings • Do not exceed them CAT III circuits - Make sure you use Cat III Leads AND Scope AND Current Clamp
Thank You • FOR PRODUCT INFORMATION AND APPLICATION NOTES PLEASE CONTACT ..... • Your Rep for Fluke products • www.fluke.com • 1 800 44FLUKE • Application Note Titlelit code # • ABC’s of DMMs G0107 • ABC’s of DMM Safety B0317 • Tune in with Power Harmonics B0221 • Measurements on ASD with Fluke Meters G0416