Download
1 / 21
210 likes | 342 Views
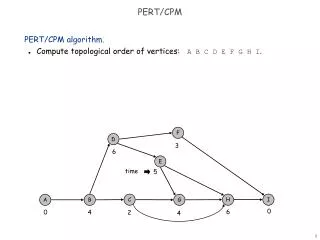
Introduction to the Pert. Maintaining Your Portfolio. Presented by Lynn Ostrem, VP Crow River Investment Club www.bivio.com/crowriver. The Rule of Five. No matter how diligent and conservative you may be in using the NAIC principles to evaluate your stocks:.

E N D
Introduction to the Pert Maintaining Your Portfolio Presented by Lynn Ostrem, VP Crow River Investment Club www.bivio.com/crowriver
The Rule of Five No matter how diligent and conservative you may be in using the NAIC principles to evaluate your stocks: One will exceed your expectations; Three will perform about as you had expected; One will probably sink out of sight
Portfolio Management Tools • Pert Report • Trend Report • Summary Report • Pert A Worksheet & Graphs • Pert B Worksheet & Graphs • Portfolio Management Guide • Challenge Tree
How to Get Started… Update Prices… …with just a click! Update Companies… Last month, we reviewed updating companies. Either refer to that presentation or click on File|Update Companies in Toolkit. If you use OPS, it updates them automatically.
How to Get Started… Review your judgments… …based on any news or information you have gathered.
Pert: Defensive Elements (Portfolio Evaluation and Review Technique)
Pert: Defensive Elements Use the Estimated Earnings for Comparison
Caution... The worse a company performs… ... the better the value will look. • Sales, EPS, PTP and Trailing 4 Qtrs measure quality. • Change your expectations in the Stock Selection Guide whenever performance falters. • People will not pay much for it,P/E will go down, Upside/Downside Ratio will go up, and Relative Value will look better. It will look great if you don’t lower your expectations!
When to Sell NAIC says…NEVER SELL . . . unless the company: • Has had an adverse management change. • Has declining profit margins. • Has had a deteriorating corporate financial condition. • Has been beset by effective competition. • Has relied on a single product that is becoming obsolete. • Has changed for the worse due to economic conditions. • Has proven to be cyclical. • Has upset the balance by company size in your portfolio.
Using PERT Worksheet - A 9 yrs of quarterly Sales, Pre-tax Profit, and Earnings Trailing 4 Quarters Makes it easy to see quarterly trends.
PERT Worksheet A Graphs Graphs: • Sales • Earnings • Pre-tax Profit • % Pre-tax Profit on Sales by • Trailing 4 Quarters • Quarterly With various growth lines for comparison.
Portfolio Summary Report Shopping List with “Buy” and “Sell” recommendations. Use 25 / 50 / 25 Zoning!
QUESTIONS? Next month’s assignment: Read the Portfolio Management Workshop Import our stocks into your Toolkit Update prices & companies next month Bring the Pert Report to the meeting
This best way to review this presentation is by printing the Notes option