Download

1 / 45
460 likes | 640 Views
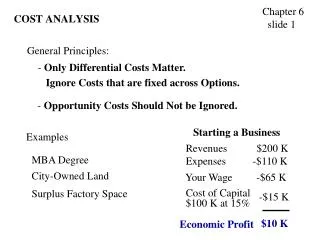
Cost Analysis. N287E Spring 2006 Professor: Joanne Spetz 10 May 2006. Costs are…. Expenditures of cash Non-cash expenditures (depreciation). Ways to divide and analyze costs. Direct vs. Indirect Direct costs Salaries, supplies, etc. Indirect costs

E N D
Cost Analysis N287E Spring 2006 Professor: Joanne Spetz 10 May 2006
Costs are… • Expenditures of cash • Non-cash expenditures (depreciation)
Ways to divide and analyze costs • Direct vs. Indirect • Direct costs • Salaries, supplies, etc. • Indirect costs • Benefits, depreciation, support departments • Variable vs. Fixed • Variable costs • Fixed costs • Semi-fixed costs (step function) • Semi-variable
What costs do you have control over? • All costs? • Direct costs only? • Variable costs only? It’s very important to be clear about the control you have
Making decisions about the future requires information about • Avoidable costs • Variable costs and some fixed costs • Sunk costs • Fixed costs that cannot be undone • Incremental costs (marginal) • Opportunity costs • Other things you could have done
A note about opportunity cost • Other things you could have done have value • Return on alternate investments • Return from basic investment • This is why is discount future earnings and costs
Discounting future earnings • $100 received this year is more valuable than $100 received next year • You could take the $100 this year and invest it to get interest for next year • Thus, future earnings are discounted • If “discount rate” is 5%, then next year is worth 5% less than this year
Numerical example of discounting • $100 per year to be received for 5 years • Year 1 - $100 no discount • Year 2 - $100 discounted 5% = 100*.95 = $95 • Year 3 - $100 discounted 5% twice = (100)*(.95)*(.95) = $90.25 • Year 4 - $100 discounted 3 times = $85.74 • Year 5 - $100 discounted 4 times = $81.45
Measuring costs in a hospital • Units are categorized by • Direct or indirect cost • Revenue-producing or not • Nonrevenue units are usually indirect costs • Indirect costs are allocated to revenue-producing units to make pricing decisions
Ways to allocate indirect costs • Step-down method • The department with the least service from others allocated first • Go in order form least to most • Problem: results vary by order of allocation • Double-distribution method • Go through the loop twice • Simultaneous equation method • Create equations for allocation and solve the math
The math problem • Fixed cost + (variable cost * quantity) = price * quantity AFTER SOME ALGEBRA… • Quantity = (fixed cost)/(price-var cost) OR • Price =((fixed cost)/quantity) + var cost
What if you go over budget? • Price change • Efficiency changes • Volume changes • Intensity changes
Creating a standard cost profile • A standard cost profile (SCP) is a cost breakdown for a single item/task
SCP for an IV… Average fixed cost = fixed units needed multiplied by unit cost
Assume that… • The nursing department was budgeted for 100 IV’s • The department did 90 IV’s • To do these IV’s, the hospital used 15 hours of labor and paid $22/hour • We can examine how this varied from our budget…
Price variance Price variance = (actual price – standard price) * actual Q = ($22 - $20) * 15 = $30
Efficiency variance Efficiency variance = (actual Q – standard Q) * standard price Standard Q = Var labor req * IV’s done + budget fixed =.10*90 + .05*100 = 9+5 = 14 Eff var = (15-14)*$20 = $20
Volume variance Volume variance = (budget Q – actual Q) * av fixed cost per unit = (100-90) * $1 = $10
These add up… • Actual direct labor cost = $22*15=$330 • Standardized cost = 3*90=$270 Difference between these = $60 • Price variance = $30 • Efficiency variance = $20 • Volume variance = $10 These add to $60 These tell us what share of overrun came from price, efficiency, volume!
Standard treatment protocols • A cost sheet for a larger “product” • E.g., an inpatient stay or diagnosis • It looks like a SCP, for the most part • For a STP, you can compute: • Intensity variance = (actual SU’s – std SU’s)*std cost per SU =(90-100) * $8.25 = -$82.5 This is favorable because fewer IV’s were done than expected.
In this example… • We went over budget • But the intensity variance was favorable
Variations in costs… Average = mean =x =Sx/N Variance = (S(xi -x)2)/(N-1) Standard deviation = variance = s If “normally” distributed: 68% will be within one std dev 95% within two std devs 99.7% within three std devs
More measures • Median • Half of sample is above • Half of sample is below • Percentiles • 25th percentile = 25% are below
Use of these statistics • You want to investigate abnormally high or low costs • You want to do investigations only when the “payoff” is worth it • Payoff defined by cost of investigation and potential benefit of correction • You can use statistics to determine your “cutoff” for investigation
Payoff tables I = cost to investigate C = cost to correct L = loss with no correction
Payoff tables and statistics • If P = probability of being in control… • (1-P) = probability of not being in control • If we investigate: • Cost = P(I)+(1-P)(I+C) = PI+I+C-PI-PC = I+(1-P)C • It we do not investigate • Cost = P(0)+(1-P)L = (1-P)L
Cost comparison • If the cost of investigating is greater than the cost of not investigating, we don’t investigate: • If I+(1-P)C < (1-P)L investigate I + C – CP < L – LP -CP < L-LP-I-C LP-CP < L-I-C (L-C)P < (L-C) – I P < ((L-C)-I)/(L-C) = 1-(I/(L-C))
How to determine P? • We can guess P based on distribution of data, or just make a best guess • We can focus on cases a certain number of standard deviations from mean to define P
When analyzing cost data… • One can examine: • Prior period values • (variance over time) • Departmental values • (variance within and across departments) • There are many numerical examples in Cleverly
As a nursing manager… • What can you do to control costs? • Identify sources of savings • Develop strategies for change
Identifying sources of savings • Reducing costs does not have to reduce quality • There is wide variation in nursing costs
Even the best performers have variance • Hamel Hospital • Total nursing cost per patient day = $186 • 21% below $235 median • Within the hospital, cost variance per patient day (compared to Hamel) • Critical care 7.4% better than median • Med-surg 3.8% better than median • Intermediate care 42.1% worse than median
Where do differences comes from? • Differences do not appear to come from • Shifting tasks to “support” departments • Reductions in skill mix • They do appear to come from • Reduced overtime • Reduced per-diem • Fewer FTEs overall (is this good or bad?)
How do you compare your hospital’s costs? • Each hospital is unique • Start with national benchmarks • Other approaches: • Across-the-board reductions • Bottom-up campaigns
Best strategy: Combination of strategies!!!
Creating a good report is important • Problems: • Comparable units not compared clearly • Benchmarking by budget assumes budget was good • No quality metrics • No staff turnover metrics • Patient days might miss stays under 24 hours • No adjustment for turnover of patients • No acuity adjustment
Creating a good report… • Problems: • Budget might reflect historical underperformance • Why is the internal benchmark 6.8? This is 5N’s actual, but it is comparable?
A better report! Units grouped by similarity Unrealistic budget? National benchmark Beating the budget but not the benchmark
Another good report Still room to improve! Internal benchmarks are important Better range of comparisons Compare to national benchmark – can be more aggressive?
Some issues & ideas • Use the internal best performer to get ideas for improving other units • Make units’ data comparable • Use the same acuity system • Make sure national benchmark has same acuity system
The problem with midnight census 7am – 3pm 24 patients 3pm – 11pm 29 patients 11pm – 7am 20 patientspatient days 24.3 = average census So… Actual HPPD Target HPPD Pt days 6.26 6.01 Blended ADC 5.15 6.01 And adjust for admissions, discharges, transfers
Be logical in figuring out where costs are uncontrollable controllable unit pat nurse regulations non-RN labor config mix comp. labor overhead supplies too expense many per FTE cost too too FTEs per much many cost per rich supply ordered used direct indirect RN too skill hours hours high mix premium age pay mix
Using nursing quality to help benchmarking Who is the best performer?