Download
1 / 12
130 likes | 355 Views
Landsat ’ s Long-Term Acquisition Plan. November 16, 2011 (A little dated, but still relevant) Presented By: Eugene A. Fosnight Landsat Data Acquisition Manager fosnight@usgs.gov Co-Authors: John Gasch, Terry Arvidson. Science Goals.

E N D
Landsat’sLong-Term Acquisition Plan November 16, 2011 (A little dated, but still relevant) Presented By: Eugene A. Fosnight Landsat Data Acquisition Manager fosnight@usgs.gov Co-Authors: John Gasch, Terry Arvidson
Science Goals • The Landsat mission is driven by the requirement to create a long-term environmental record guided by the Long-Term Acquisition Plan • Individual user requests and science campaigns are accepted, but only so far as they do not perturb the Long-Term Acquisition Plan. • Individual user requests are most likely to be accepted if they have associated field campaigns or are for emergency response. Night acquisitions are only acquired by special request. • Science campaigns tend to target areas associated with large mapping projects for which the temporal period is well defined, occasionally repeating, and tend to have a low priority boost leading to a moderated increase in the probability of acquisition. • To meet these goals the Landsat Long-Term Acquisition Plan continues to evolve through lessons learned in response to new inputs, aging satellites, and new satellite capabilities
Long-Term Acquisition Plan controls • Vegetation phenology quantified by seasonality files or NDVI • Cloud predictions avoid acquisitions of “relatively” cloudy data • Cloud climatology quantify “relatively” cloudy data • Automatic Cloud Cover Assessments of acquired images identify successful acquisitions • Missed opportunity boost • Thematic Campaigns – requirements not well represented by seasonality: reefs, agriculture, volcanoes, glaciers,…
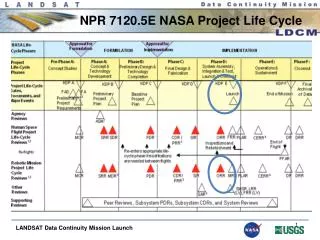
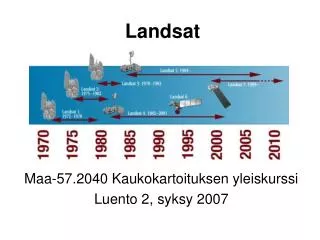
Long-Term Acquisition Plan controls X • Landsat 5 • Has no onboard recorder, so can image only within line of site of ground stations • Acquired all images (309 - 439 depending on season) within line of sight of a reception station (up to 20 active) prior to the failure of the redundant transmitter • Acquired using a simplified LTAP following the failure of the redundant transmitter in December 2009, which has now evolved to be the most advanced of the LTAPs • Acquires on average 211 - 266 images/day or 65% of opportunities after the primary transmitter was restarted • The number of images/day acquired is constrained by health and safety of the mission – new constraints as of last week limit acquisitions to about 150 images/day • Landsat 7 • Acquires using a formal LTAP since launch in 1999 • Has a solid state recorder that facilitates global acquisition of images • Images about 250 – 400 images per day out of 540 - 630 opportunities limited by • duty cycle and storage capacity constraints and • the amount of sun lit land available on a given day • Since the Scan Line Corrector failure, the LTAP pursues image pairs to facilitate compositing • Landsat 8 • Will acquire using a formal LTAP • Has a solid state recorder that facilitates global acquisition of images • Will acquire about 400 images per day
L5 Sun Angle Constrained Coverage Solar cycle moving strongly southward. Imaging presently allowed (sun angle constraint) between the red horizontal lines
L7 Sun Angle Constrained Coverage Solar cycle moving strongly southward. Imaging presently allowed (sun angle constraint) between the red horizontal lines
Landsat 7 Seasonality Plots for Path 199 Graphs show relationship between NDVI, seasonality records, and acquisitions from Norway to Liberia. Black circles are images acquired with circles proportional to cloud cover (small – high, large – low) Yellow vertical lines are sun elevation cut off dates Red (acquire once) and blue (acquire always) lines represent the discrete seasonality records NDVI Max upper dotted line Mean + SD Mean green circles Mean – SD Min lower dotted line Upper left text – land database records Lower left text – ecosystems
LTAP in Summary • Path 199 example – lessons observed • Acquire too frequently over arid areas • Acquire too seldom over persistently-cloudy vegetated areas • The need to balance the cost of acquiring a high proportion of cloudy data with the need for finding the rare cloud-free sub-images is compounded by the low confidence in the cloud predictions in the tropics. • The use of priorities derived from NDVI (which is attenuated by clouds…) and the incorporation of cloud confidence should help us find a better balance. • LTAP similarities • Acquire 60-70% of opportunities • Always over the conterminous US • Somewhat less over deserts and snow • In general about 10-15 images per year for a typical vegetated path/row • High latitudes are sun limited, but acquire at same rate as other vegetated sites during their growing season. • Boreal, tropical and Antarctica campaigns help compensate for lack of opportunity caused by clouds or very short season.
LTAP differences X • Landsat 5 • Interval-based acquisitions and many other instrument constraints! • NDVI-based phenology • MODIS cloud climatology • Cloud prediction confidence • Landsat 7 • Discrete seasonality record phenology derived from AVHRR NDVI migrating in 2012 to probabilities derived directly from MODIS NDVI • ISCCP cloud climatology migrating to MODIS cloud climatology • Migration to cloud prediction confidence • Increased acquisitions from 300 to 380 images/day in 2011 • Landsat 8 • LTAP is frozen at Landsat 7 LTAP circa September 2008 • Modeling to evaluate and tune Landsat 8 LTAP is planned for 2012 • Migration to Landsat 7 logic will begin following launch • Acquire 400 images/day
The future of the Landsat LTAP • The way forward • Parameter tuning will continue as new data, such as NDVI, Cloud Climatology and confidence estimates, are evaluated and implemented. • A land ACCA score will improve the acquisition of island/coastal scenes. • Increase focus on QA/QC of archive. Do the images acquired meet the expectations of the LTAP requirements? • Unlimited access to data has established a new paradigm where partially cloudy data have increased value. • LTAP evolution will provide • a direct measurement of vegetative phenology augmented by permanent campaigns, • higher resolution cloud climatology, and • an estimate of cloud prediction confidence • Permitting a more nuanced balance between the need for • additional coverage of persistently cloudy areas, and • less coverage of slow changing persistently clear areas, • while accommodating requirements distinct from scene-based phenology. • The Landsat acquisition strategy remains focused on maintaining a long-term global environmental record.