Download
1 / 12
120 likes | 129 Views
This study presents a method for mapping river discharges by incorporating river network dependencies. It utilizes kriging and disaggregation approaches to account for the spatial and temporal variations in runoff characteristics. The technique ensures consistency in space and time, taking into consideration the hierarchy of discharge data imposed by the river network structure.

E N D
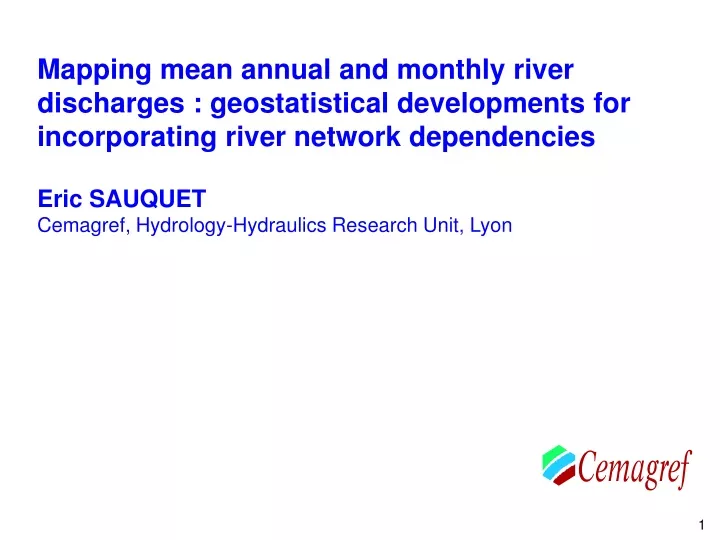
Mapping mean annual and monthly river discharges : geostatistical developments for incorporating river network dependencies Eric SAUQUET Cemagref, Hydrology-Hydraulics Research Unit, Lyon
N ( ) å ( ) = q A l q A 0 i i i=1 Method : Kriging and disaggregation approach with A0 is one of the elements of a partition, Ai, i= 1, …, N, gauged basins To resolve these problems: - streamflows are expressed in water depths - the algorithms involve characteristics derived from runoff generated by sub-basins defined by gauging stations (independent variable) - distance between two basins is the average distance between all couples of points between the two basins How to adapt kriging for mapping runoff characteristics ? Streamflow data: • are affected by scale effect (the size of the gauged basin) • are organised by the river network with upstream-downstream dependencies (overlapping drainage area) • are measured at one point, not representative of the basins
Homogeneity No Maps of x, y, z Yes f Map of q River flow time series observed at N gauging stations DEM and river network Runoff characteristics qfor N sub-basins Heterogeneity q* = f(x,y,z,…) err = q-q* Kriging applied to q Map of q Map of err Map of q*
Application • Variable under study : qa runoff generated by portion of gauged basins and weight coefficients related to EOF analysis • Stations with strong karstic influences ( ) are excluded • River network deriving from 1 by 1 km Digital Elevation Model is considered • Elevation is supposed to be the most influencing factor for spatial variability • France is divided into ten regions and • empirical formulas incorporating • elevation are derived for each of them to test homogeneity • Target partition is composed by 6000 elementary areas
9 4 Region Nb stations R²(%) 1 111 63 2 48 19 3 134 48 4 154 4 5 218 35 6 211 40 7 36 50 8 81 64 9 73 41 10 136 43 Variable errqaerrqa errerrerrerrerrerr Fitted model to the empirical variogram: Application to mean annual runoff Linear regression: qa = aH +b err = qa - (aH+b)
The interpolation deals with dimensionless discharges free from scale effect: where qm(A,t), t= 1,…,12 is the time series of long term monthly average runoff generated by the element A and To keep the month-to-month dependence within the flow pattern, the time-series of f is interpreted as a linear combination of P temporal amplitude functions Tiinvariant in space and representative of the study area: Mapping monthly pattern A temporal disaggregation of the mean annual runoff is suggested to ensure consistency with the map of qa. T and S are given by EOF analysis
97% 99% 92% The temporal amplitude functions T
Interpolating the weight coefficients S f(A,t)=S1(A)T1(t)+S2(A)T2(t)
( ) é ù æ ö D P 1 qa A ( ) ( ) ( ) å å ç ÷ = + D D i QM u , t 1 S A T t A ê ú ç ÷ j i j i A 12 ê ú è ø ë û D Ì = A A j 1 i qa(DAi) QA(u) Estimating runoff along the river network River flows are deduced from runoff value estimated for each cell DA by aggregation along the river network
Maps of monthly discharges January July
Conclusions A technique based on objective methods specially adapted to account for the related drainage basin supporting areas and the hierarchy in the discharge data imposed by the structure of the river network was presented To interpolate the twelve mean monthly discharges, a method keeping the auto-correlation between successive terms is used. The developed procedures ensure consistency in space and in time: the continuity equation is fulfilled by aggregation along the water path and the temporal redistribution of annual values ensures monthly estimates coherent with the intra-annual water cycle and with the annual values of discharge The next steps should involve: - assessing the uncertainty in the procedure (cross-validation) - comparing with other methods - testing other explanatory variable (climate indices, land-use descriptors…) - testing the benefits of using homogeneous regions