Download
1 / 1
10 likes | 142 Views
Figure 1 : Flow Chart of Sample Selection of the 5350 Whitehall II participants. Included in Whitehall II ( 1985-1988, n = 10 308). Excluded (n = 2363) Died before screening or non-response. Phase 3 (1991-1993, n = 8815) Baseline of the current analysis. Excluded (n=1783)

E N D
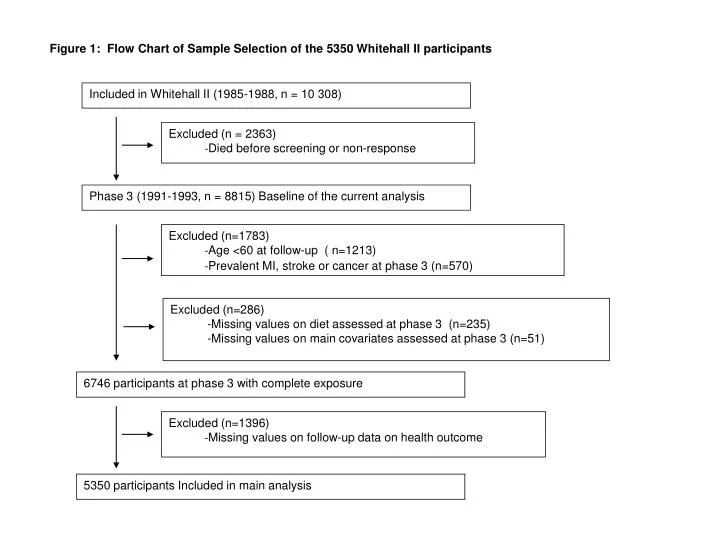
Figure 1: Flow Chart of Sample Selection of the 5350 Whitehall II participants Included in Whitehall II (1985-1988, n = 10 308) • Excluded (n = 2363) • Died before screening or non-response Phase 3 (1991-1993, n = 8815) Baseline of the current analysis • Excluded (n=1783) • Age <60 at follow-up ( n=1213) • Prevalent MI, stroke or cancer at phase 3 (n=570) Excluded (n=286) -Missing values on diet assessed at phase 3 (n=235) -Missing values on main covariates assessed at phase 3 (n=51) 6746 participants at phase 3 with complete exposure • Excluded (n=1396) • Missing values on follow-up data on health outcome 5350 participants Included in main analysis